Bitcoin and Ethereum: Bitcoin close to $30000 yesterday
- Since the beginning of this week, we have seen an increase in volatility on the Bitcoin chart.
- Ethereum’s price jumped to the $1640 level yesterday, forming a new 10-day high price.
Bitcoin chart analysis
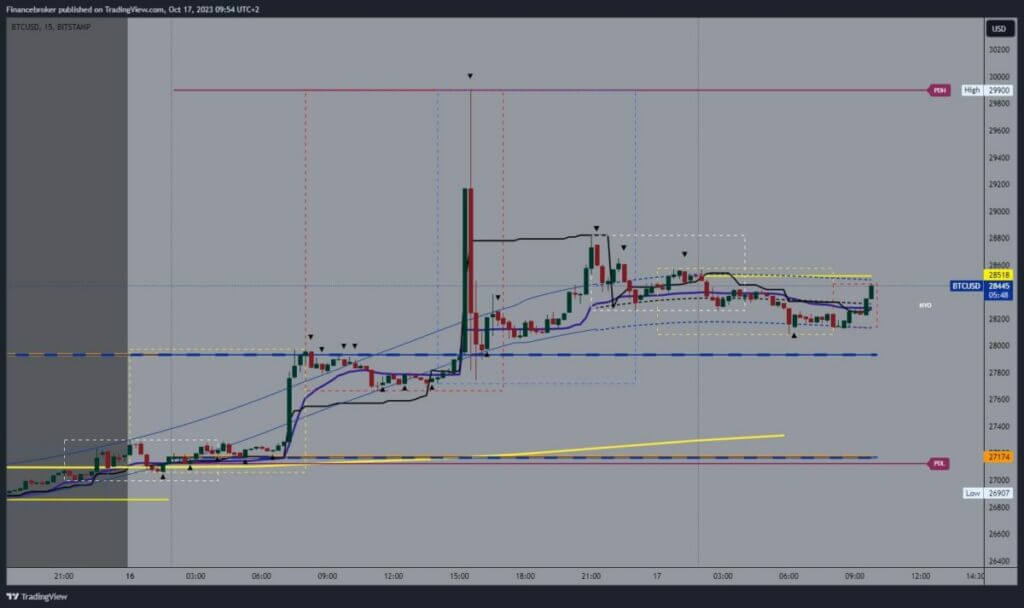
Since the beginning of this week, we have seen an increase in volatility on the Bitcoin chart. A strong impulse made Bitcoin jump to the $29900 level yesterday. This was followed by a quick pullback to the $28,000 support level. Since then, we have been above that level and are moving into a new bullish consolidation. We managed to form a new high at the $28,800 level so that we could make a pullback from that place again, but now only up to the $28,200 support level.
The new bullish consolidation manages to move us above the $28400 level, and we could soon test the $28500 level. Potential higher targets are $28800 and $29000 levels. We need a negative consolidation and a price drop below $28200 of the previous low for a bearish option. After that, we would be able to test the next level of support at the $28,000 level. Potential lower targets are $27800 and $27600 levels.

Ethereum chart analysis
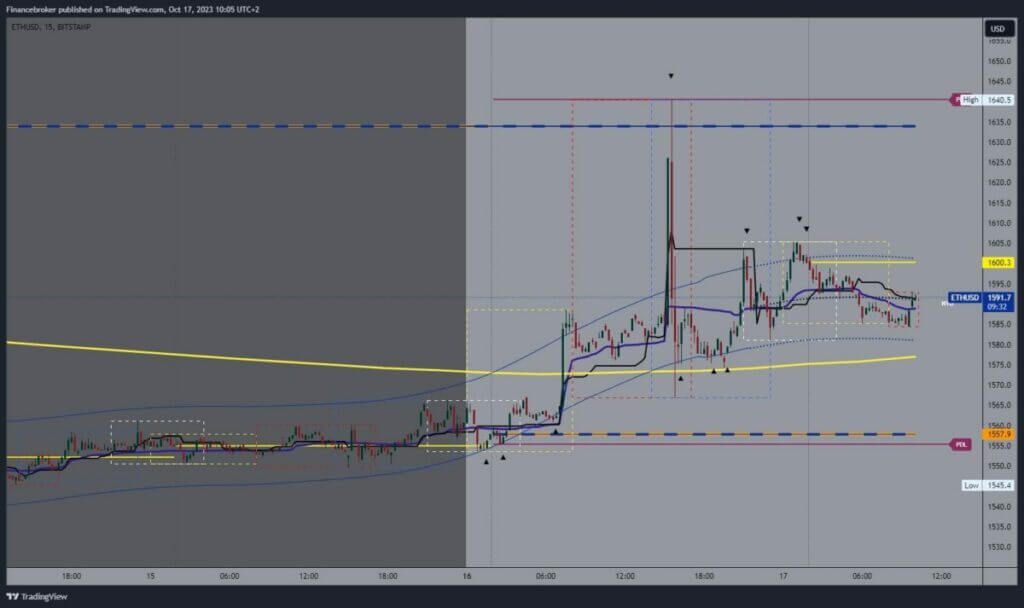
Ethereum’s price jumped to the $1640 level yesterday, forming a new 10-day high price. A pullback and retreat to the $1,570 level soon followed. After that, Ethereum managed to consolidate above that level and move above the $1580 level. There, it gets support in the EMA50 and starts a positive consolidation level up to $1605. At that level, we encounter resistance and retreat again to the $1585 level, where we form a higher low.
The new support leads to the start of another bullish consolidation and a jump to the $1592 level. Potential higher targets are the $1600 and $1610 levels. We need a negative consolidation of the price drop to the $1580 support level for a bearish option. A break below would drop us below the EMA50 moving average, which would increase the pressure on the price to continue down. Potential lower targets are $1570 and $1560 levels.


