Bitcoin and Ethereum: Dramatic falling again
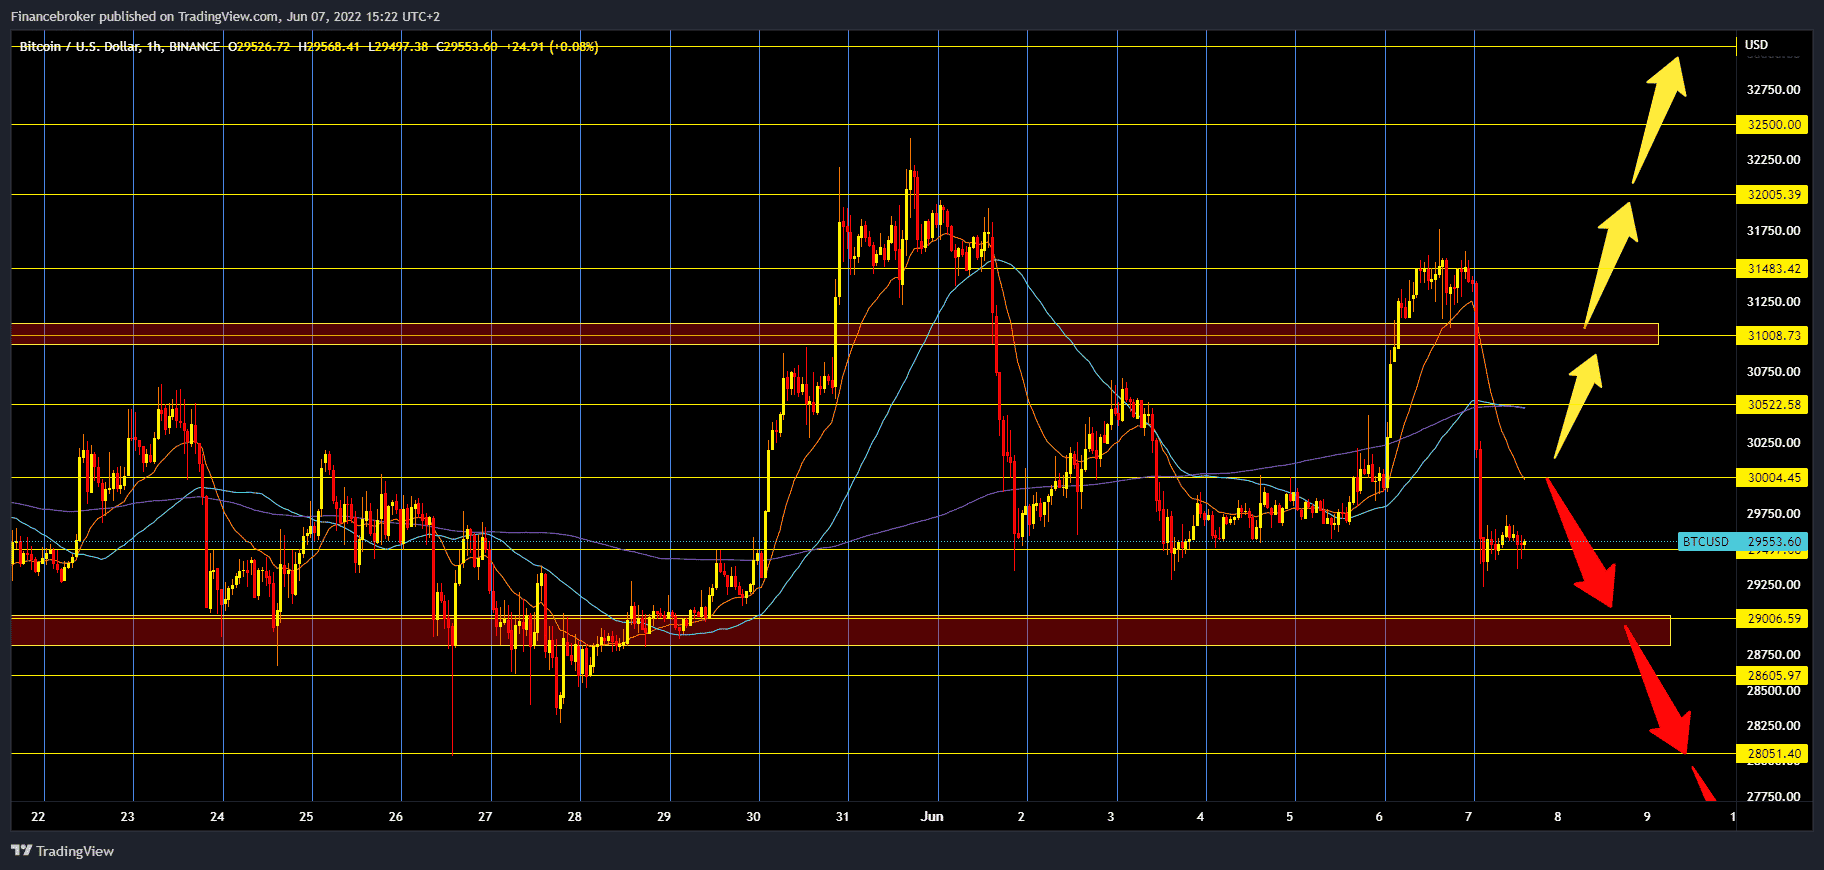
- Bitcoin fell again early this morning and fell by $ 2,000, from $ 31,500 to $ 29,500.
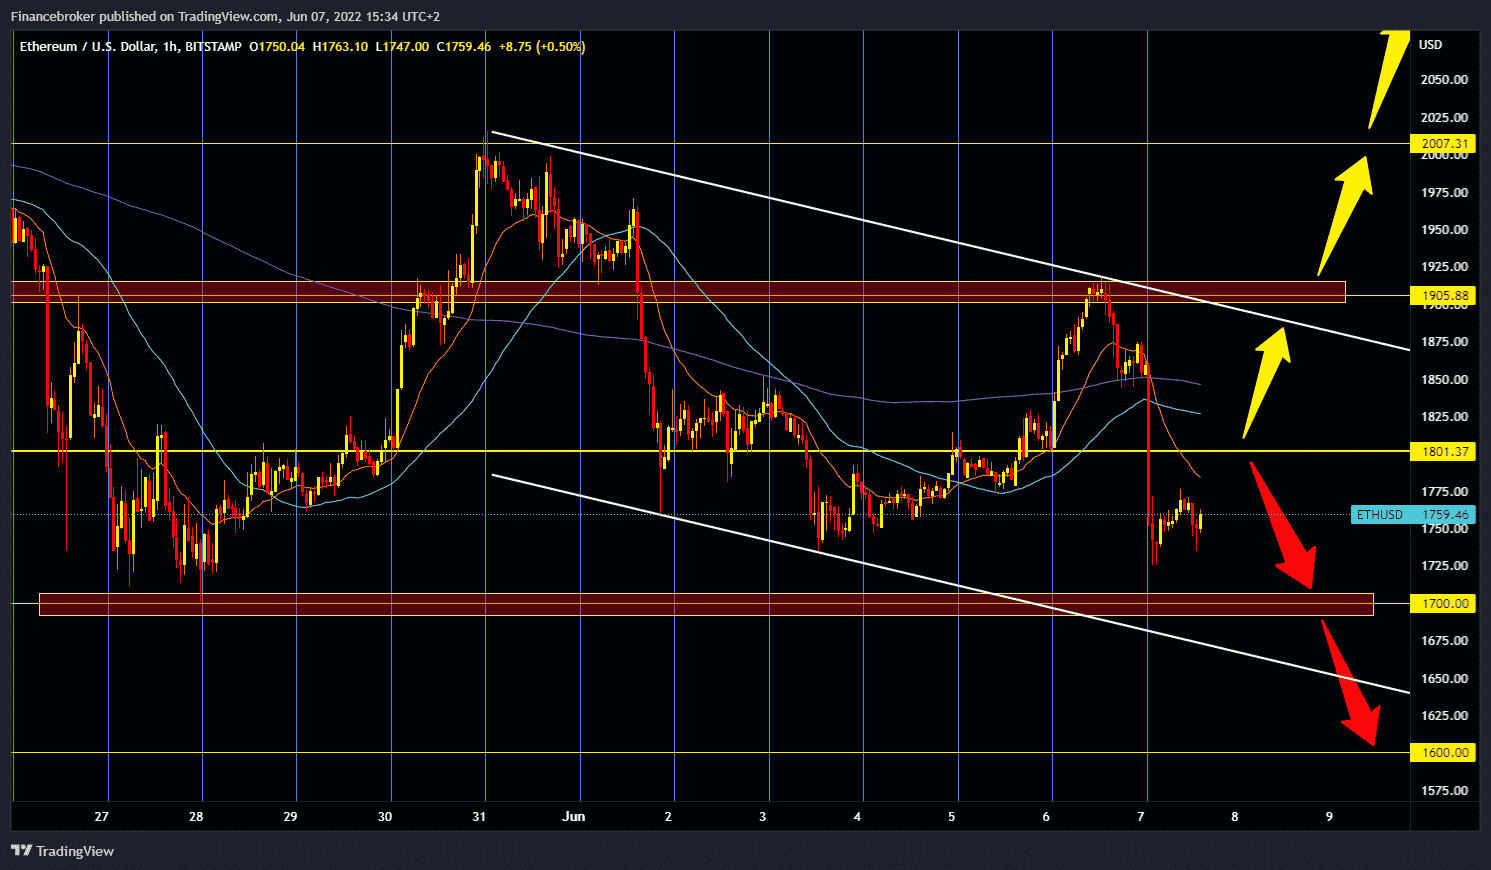
- The price of Ethereum follows the price of Bitcoin because we saw a drop this morning from yesterday’s $ 1915 to $ 1725.
Bitcoin chart analysis
The price of bitcoin fell again early this morning and fell by $ 2,000, from $ 31,500 to $ 29,500. We are very close to a large support zone at $ 29,000. The current consolidation is still under great bearish pressure, and the price could soon take a new negative step. The move is similar to the stock price from June 1, when Bitcoin fell from $ 32,000 to below $ 30,000. The lack of volatility has led to a slight decline in trading volume, with bitcoin rarely exceeding $ 30 billion in daily volume.
More than $ 218 million worth of positions on derivatives exchanges has been liquidated in the last 24 hours, according to Coinglass.
The cryptocurrency once again showed a positive correlation with shares during the sell-off, as Nasdaq futures experienced a 0.95% drop at the same time as bitcoin fell from $ 31,500 to $ 29,500. However, Yassine Elmandjra, a crypto asset analyst at ARK Invest, noted that the overall correlation of Bitcoin with S&P has reached new all-time highs on a 30-day basis.
Talking further about the price action of BTC, he claimed that the “main” trend lines remained intact on BTC / USD, even having in mind the fall in May to 23,800 dollars. As Cointelegraph reported, it was still ripe for retesting in the eyes of many.
Ethereum chart analysis
The price of Ethereum follows the price of Bitcoin because we saw a drop this morning from yesterday’s $ 1915 to $ 1725. Today, the Ethereum price traded slightly lower after hitting resistance near the $ 1850 zone. However, although the cryptocurrency is trading below the lower resistance line withdrawn from the May 31 high, it remains above the key support area of $ 1685. A clear and decisive break below 1685 would also confirm the upcoming lower minimum on the daily chart. It could encourage the bears to push the price towards the territory of 1395 dollars, a level that was supported in February last year.