AUD/JPY analysis for April 9
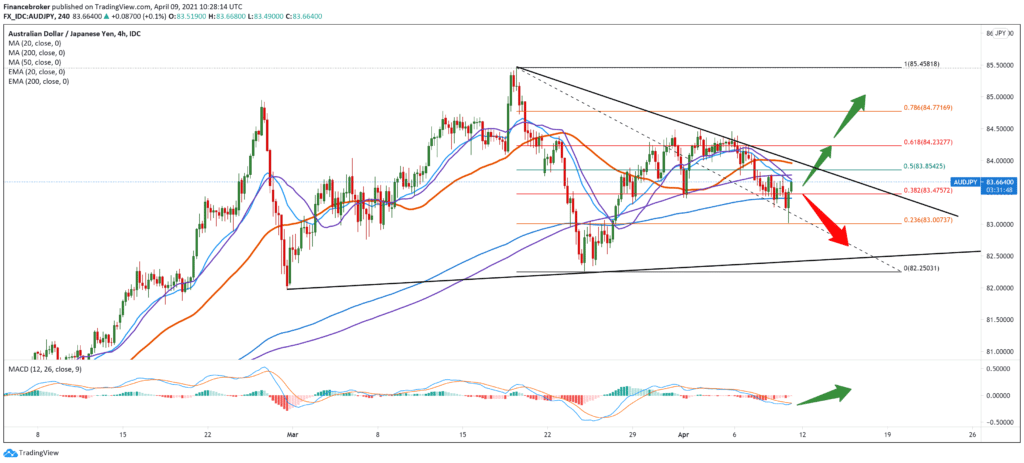
Looking at the chart on the four-hour time frame following the Fibonacci retracement of the level, we see a pullback to 61.8% of the level, and then again the continuation of the bearish trend. We can expect the pair to consolidate slightly around 38.2% to 83,475 and then continue descending to the previous low of 82,250. Of the moving averages, only the EMA200 provides support, while the rest are all on the bearish side. Looking at the MACD indicator, we see that it is making a slightly upward turn, the blue MACD line is testing the signal line, and we need a stronger break to have a stronger bullish signal.

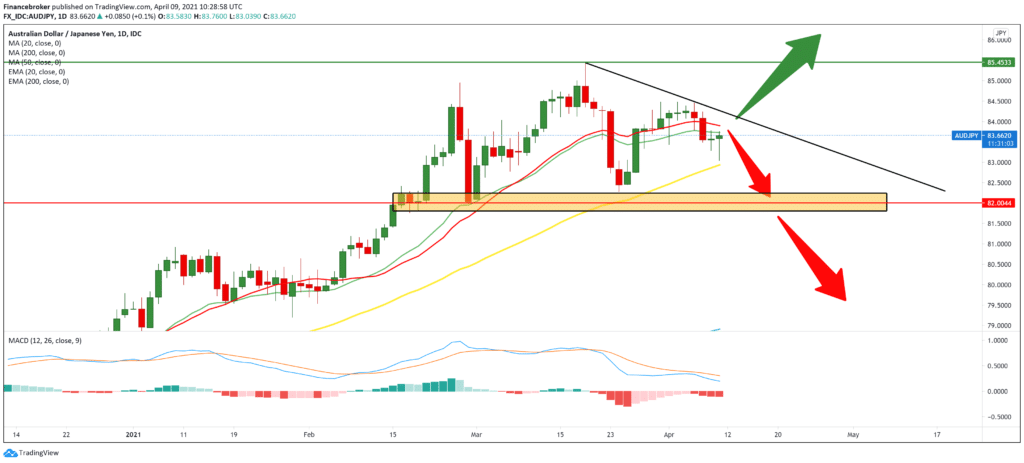
We see that we have two neutral candlesticks on the daily time frame and are currently testing MA20 and EMA20 in the zone of 83.50-84.00. Continuation of the pullback is very likely in the next short term, and we can expect the pair to drop to 82.00, where we will have stronger support. To continue the bullish trend, we need a break above the mountain resistance line and a break above the MA20 and EMA20. The MACD indicator is directed towards the bearish side and the potential continuation of the bearish trend.

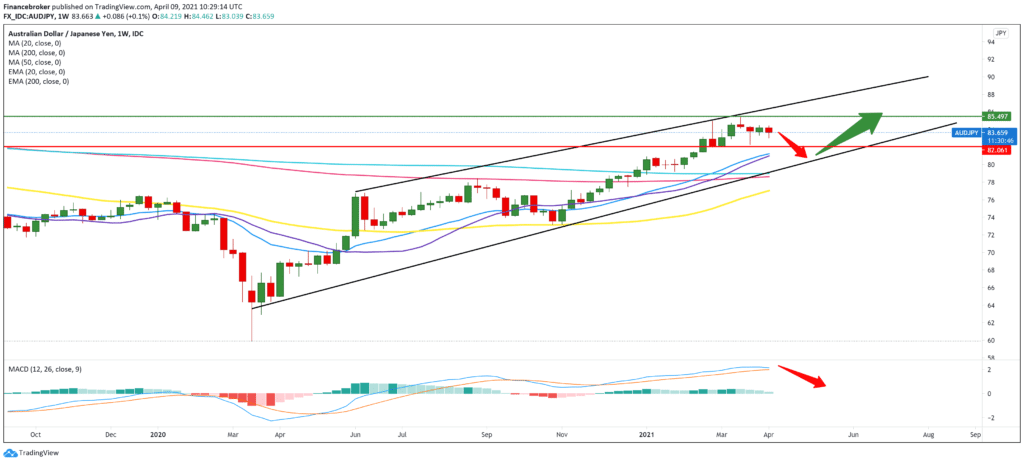
On the weekly time frame, we see a reversal within a large upward trend, and that after touching the top line, the pair makes a pullback descending looking for the next support. We seek support on the channel’s bottom line with the help of moving averages MA20 and EMA020. If we follow the MACD indicator, we see that the lines make a slight downward turn directing us to the bearish side. Based on that, we are just at the beginning of a potential bearish trend.

-
Support
-
Platform
-
Spread
-
Trading Instrument


