What Is Ascending Channel Pattern?
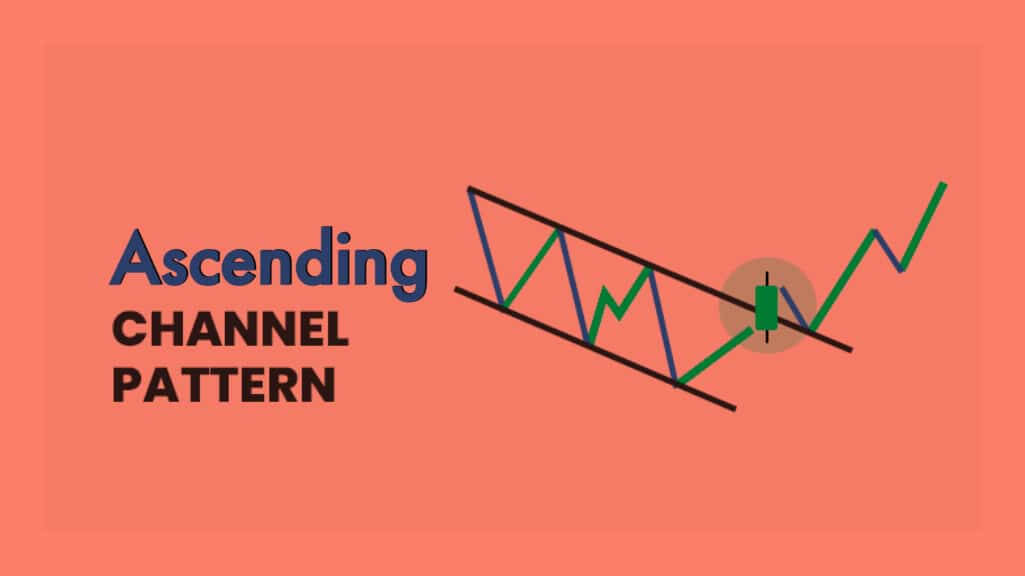
As can be seen from the title of the article, today’s article is about an ascending channel pattern. Do you know what ascending channel pattern is?
In order to better understand all the details, we need to start from the beginning. So, what is a channel?
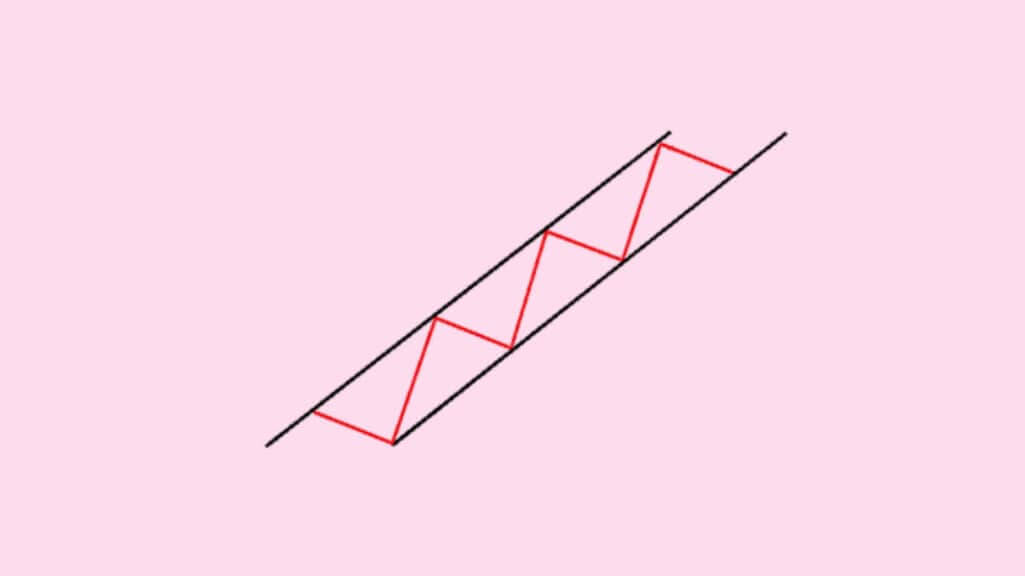
It is a chart pattern, also known as a parallel channel. Interestingly, it is made up of two parallel lines that connect consecutive highs as well as lows and contain prices between them. Thanks to channels, it is easier to identify a trend. Interestingly, it is also easier to predict price actions.
It is desirable to remember that they are divided into three categories: ascending, descending, and rectangle. Let’s focus on an ascending channel pattern.
An ascending channel, also known as a rising channel, is a chart pattern. It consists of two parallel upward-sloping lines. An ascending channel occurs when a chart has higher swing highs and lower swing lows. In most cases, the pattern shows that prices are in an uptrend.
In this case, the pattern can be considered bullish. Sometimes, even though an ascending channel may form within a longer-term downtrend. In this case, the pattern, most often than not, means a pause in the downtrend, though occasionally, it is an early sign of a reversal.
What do you need to know about an ascending channel?

here are various strategies that involve the above-mentioned pattern. For example, one strategy relies on prices staying within the channel. It is better to use that strategy in a low- or medium-volatility environment.
However, there is a more popular strategy. Importantly, the more popular strategy is to wait for a breakout. Any breakout is considered a strong signal, but usually, traders prefer to sell after prices reverse their movement and close below the lower border of the channel.
In order to avoid false breakouts, it makes sense to utilize other technical indicators as well. For example, moving average convergence/divergence (MACD) or relative strength index (RSI.)
Traders may also require that a significant increase in volume should accompany a breakout. It is also better not to enter a position immediately after prices cross the border.
In most cases, an entry can be made via a short position at 10% of the channel’s height below the channel’s floor.
If prices regularly fail to reach the upper border of the channel for a period of time while touching the lower bound of the channel, that suggests that the uptrend is waning and a downside breakout is more likely. It is noteworthy that the usual profit-taking level in case of a breakout is at the channel’s height below the channel.
The importance of risk management
Now, let’s discuss forex risk management. It is important to pay attention to risk factors. So, it is vital to create a risk management plan in order to minimize the risk.
There are several risk factors, and one of them is currency risk. It is the risk associated with the fluctuation of currency prices.
We shouldn’t forget about interest rate risk. A central bank’s decision regarding interest rates has the potential to influence the situation. Traders should keep an eye on central banks in order to miss any important news.
First of all, you need to understand how the world’s largest financial market works. It is important to note that the largest financial market is made up of currencies from all over the world, such as USD, CHF, GBP, etc. The forces of supply and demand primarily drive the forex market.
You need to work hard in order to create a good trading plan. A comprehensive plan has the potential to make your life easier. For instance, a plan can help you maintain discipline in the volatile forex market. The main point of a trading plan is to answer important questions, such as what, when, why, and how much to trade.
It is important to create your own plan. Some people may be tempted to copy someone else’s plan. However, it is better not to copy someone’s plan. Traders have different goals, opinions, etc. It is better to create a plan that will be based on your needs.
How to reduce the risk (part two)

Are you familiar with a risk-reward ratio?
First and foremost, it is vital to set a risk-reward ratio.
As part of your trading plan, you need to set your risk-reward ratio in order to quantify the worth of a trade. In order to locate the risk-reward ratio, compare the amount of money you are risking on an FX trade to the potential gain.
It isn’t a good idea to ignore the importance of emotions. Humans quite often make decisions based on their emotions. However, you need to be careful when it comes to emotions and their influence on the forex market.
Emotions such as fear, temptation, and greed have the potential to influence your decisions. Don’t let your emotions control you. You need to control your emotions and vice-versa.
Making predictions about the price movements of currency pairs can be quite difficult, as there is no lack of factors that could affect the market. In order to make sure you aren’t caught off guard, keep an eye on central bank decisions. Moreover, it is desirable to monitor political news and market sentiment.
Forex indicators
Indicators are considered vital when trading in the forex market. The list of top forex indicators is quite interesting.
One of them is the moving average (MA). It is an important forex indicator that indicates the average price value over a specific period that has been chosen.
Fibonacci is also a good forex indicator. It indicates the exact direction of the market. Forex traders utilize Fibonacci in order to spot areas and reversals where profit can be taken easily.
What about the relative strength index (RSI)?

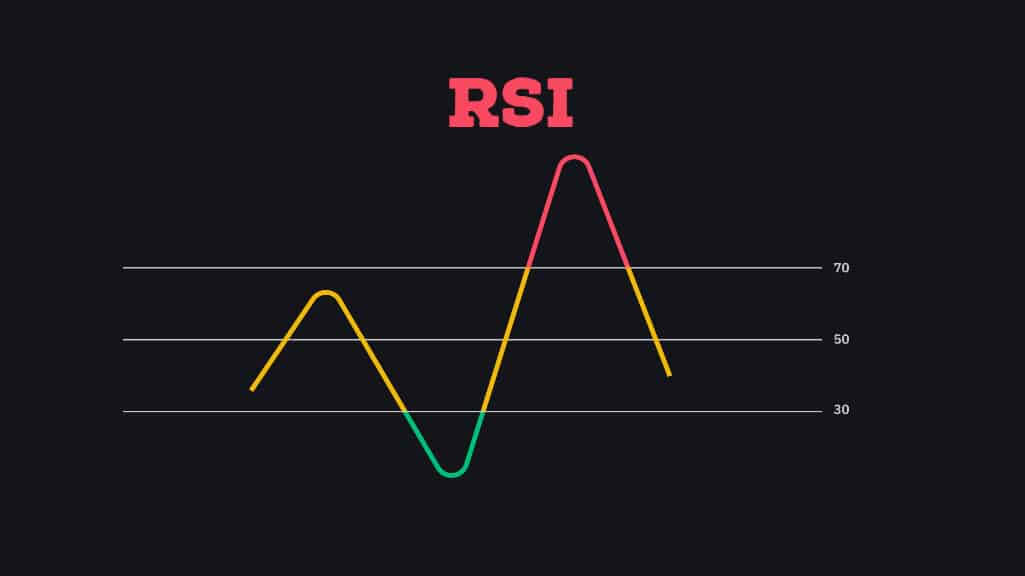
The relative strength index is another forex indicator that belongs to the oscillator category. Traders commonly use the above-mentioned forex indicator. It highlights an oversold or overbought condition in the market that isn’t permanent.
As a reminder, an RSI value of more than 70 shows an overbought market. Interestingly, a value below 30 shows an oversold market. Importantly, some traders utilize an 80 RSI value as the reading for overbought conditions and a 20 RSI value for the oversold market.
The list of top indicators would be incomplete without moving average convergence/divergence or MACD. Interestingly, MACD is one of those indicators that tell the force that is driving in the world’s largest financial market.
Now, we can move on to the parabolic stop and reverse (PSAR.) This forex indicator is used by traders in order to arrive at the direction of a trend and evaluate short-term reversal points of a price. It is worth noting that the above-mentioned indicators are mostly used to locate spot entry and exit positions.
To sum up, it is desirable to pay more attention to an ascending channel pattern. As you can see, you don’t have to be a financial guru in order to understand what it is.


