What is Adam and Eve chart pattern?
Chart patterns can have really curious and funny names, like in the case of Adam and Eve chart patterns. It’s a rare chart analysis pattern consisting of a double top or bottom formation. Also, Adam and Eve chart patterns are very reliable and accurate trading signals. However, it only works in high trading volumes in the market. In this article, we show you the main features of this unique chart pattern. Also, we will see how to spot and interpret these patterns and how to trade them correctly. Let’s get it started.
What is the Adam and Eve chart pattern?
This pattern is a bullish and bearish reversal chart pattern. The pattern was first mentioned in the book Encyclopedia of chart patterns by Thomas Bulkowski. It’s a variant of the double bottom and double top patterns.
Also, it’s a little bit different from the classic double top/bottom pattern. Its formation consists of two highs.
The first one is a peak, and the second one has a round shape. Adam and Eve’s patterns are very useful for determining entry levels in trading. It gives complementary information about the price of an asset failing to go below or above a certain price level.
Let’s see what types of formation we can spot regarding these patterns.
We can spot two types of this chart pattern. The first one is Adam and Eve double bottom, and the second one is Adam and Eve double top.
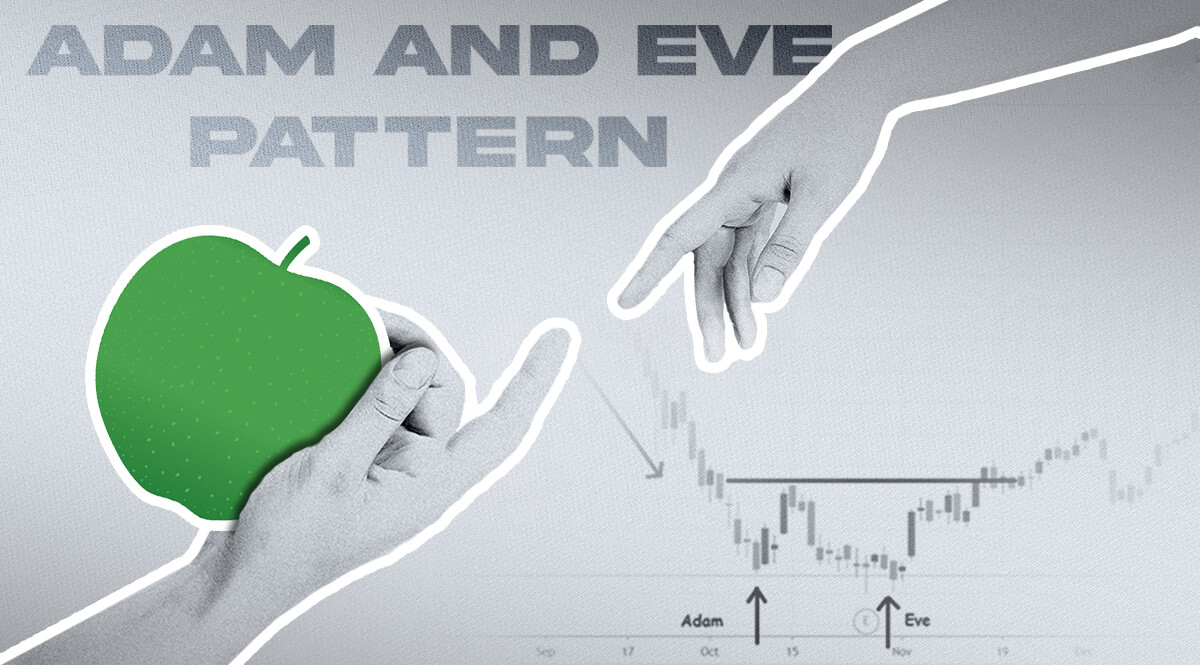
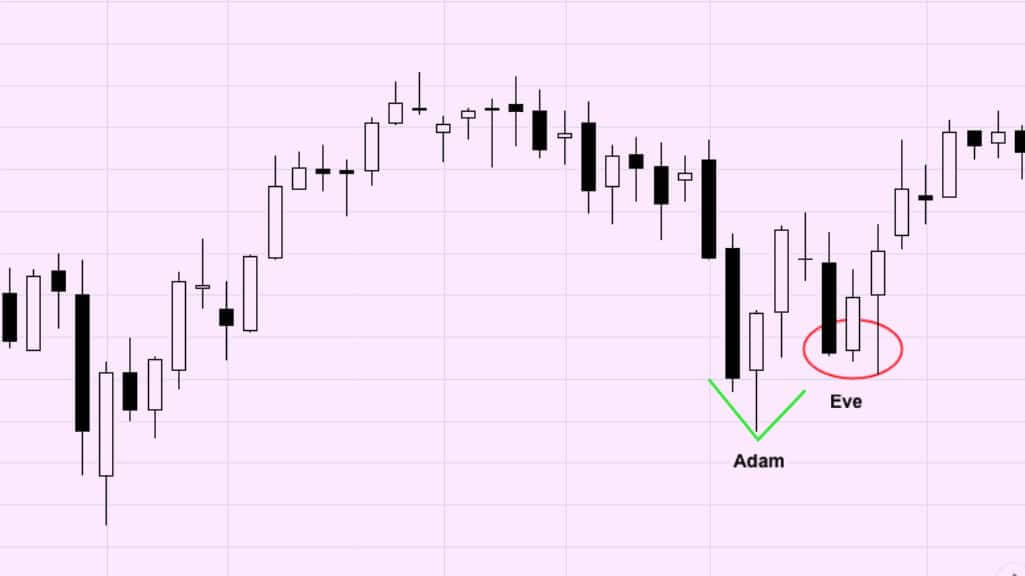
The first one occurs in a downtrend creating two bottoms prior to an upwards trend. Looking closer, you will notice that the first bottom is shaped like the letter V. This first bottom is called Adam.
The second bottom forms a shape of a letter U and is called Eve. The Adam and Eve double top occurs in an uptrend with two tops before a bearish trend reversal. The first top is in the shape of an upside letter V, and the second top takes the shape of an upside letter U.
What Does the Adam and Eve Pattern Indicate?
This chart pattern shows solid price levels and changes in market sentiment. When the asset price varies up and down, new highs and lows appear, defined by an Adm figure. That’s where the support and resistance occur. If the price of an asset doesn’t break through this level, it varies, going up and down and forming a U shape and new support resistance level.
If the price doesn’t trespass to this level, we have the continuation of the previous market trend, and if the price breaks through, a new trend are about to start, and a new entry point can be identified.
What is a double-top Adam and Eve pattern?
A double top is a reversal pattern that appears when an asset price ends an uptrend. We easily recognize this figure which takes the form of an M and portends a bearish reversal.
A double top Adam and Eve are recognizable by its two peaks above the support line, also called the neckline. Once the first peak is reached, the buying current runs out of steam, and the price goes down to its support before rising again until reaching the second peak, which corresponds to the same level as the first.
This second attempt by the buyers to overcome the resistance again ends in failure, strengthening the selling trend. If the first time, the buyers managed to bounce the price of the crypto-asset from its support zone until it returned to its highs, this is not the case this time.
At the second attempt of the selling current, the support is pressed, the reversal pattern is then validated, the balance of power is reversed in favor of the sellers, and the price then accelerates downwards.
Note that for the double top to be confirmed, the retracement must be larger than the initial retracement following the first peak. In other words, the break of the neckline (which corresponds to the support) sends a strong signal of a trend reversal, in this case, a downward reversal.
What is a double-bottom Adam and Eve pattern?
The double bottom is a bullish reversal pattern. It takes the shape of a W and appears at the end of a downtrend. It indicates the reversal of a downtrend. Also, this pattern shows the shortness of the selling trend. The asset prices fail to push the lowest, resulting in a sharp decrease in the asset price.
In addition, you can identify the double bottom Adam and Eve according to its two troughs forming under the resistance point, also known as the neckline. You will spot the first low at the end of the downtrend. When the low point is reached, the price takes advantage of buybacks and bounces up to the neckline or resistance.
Buyers were unable to break through resistance during their initial attempt, causing the price to dip. On the second attempt, however, sellers were not able to hold the line, and the buyers managed to exceed the resistance.
This reversal of power causes the price to rise, but the trend is not confirmed until the price breaks the neckline for a prolonged period of time, as well as is accompanied by a rise in trading volume.
The double top and the double bottom are easily identifiable chart patterns. They give valuable clues about future changes in the price and therefore increase the chances of a successful trade.
They are to be used in combination with other chartist analysis tools in order to have an overall idea of the trends concerning the price of an asset.
How to interpret Adam and Eve chart patterns?
The double top and double bottom always materialize in 4 distinct phases.
To see a double top, the first top will form (phase 1) during a strong uptrend. Then a first correction will take place, thus determining the neckline (phase 2).
Then, the price of the asset will rise again and form a second peak (phase 3) relatively similar to the first before retracing the entire rise to break the neckline (phase 4). Once the latter has been crossed, the downward trend continues over the medium or long term.
To see a double bottom, the first dip occurs in a downtrend (phase 1) before a retracement sets in to retest the neckline (phase 2).
This forms the first leg of the figure. Then the movement will repeat a second time with a drop (phase 3). Finally, a return to the neckline (second leg) again before crossing it to initiate a sustainable uptrend.
Breakout trading strategy using Adam and Eve chart pattern

The best trading strategy is the breakout trading strategy. This strategy implies that once the price breaks out above the resistance level or under the support level, traders should enter the trade poisoning stop loss at a neckline level.
If you trade double top Adam and Eve, when the asset price breaks the lowest level of the pattern, a new price trend starts. It’s a good level for entering a position when the price goes below the support level.
How to set a goal with these graphic configurations?
In the case of a double top, you must report the height of the figure below the neckline. This height will be the difference between the neckline and the resistance line forming the two peaks. The technique is inversely similar to the case of a double bottom. For a triple-top configuration, you will need to reference the highest top of the three.
How to take a position on the double top and double bottom Adam and Eve patterns?
Studying your price charts can reveal two different types of representation of a double top/bottom:
While the top/trough very often forms a peak, it can also take on a more rounded shape.
It may happen that the second peak/trough is slightly higher or lower than the first. Don’t look for perfect symmetry!
This is why, before making any decision on this kind of chart pattern, it is important to seek confirmation through other technical indicators.
Momentum indicators are particularly suited to these graphic configurations, such as the relative strength index (RSI) or the MACD.
Once the time has come to make a decision, investors or traders generally take a position once the figure is well marked and a crossing (upward or downward as the case may be) of the neckline by a closing candle.
Adam and Eve chart pattern – Conclusion
Adam and Eve chart pattern is a reliable and accurate trading signal announcing a reversal in the market. It’s one of the strongest signals for reversals.
Though it’s quite rare in graphs. It falls into the group called triangle patterns. It can predict bearish and bullish reversals, and it is the best indicator for use in a breakout trading strategy.
However, for better precision, it’s advisable to combine this pattern with MACD and other indicators. Also, beware that this pattern is not working with low trading volumes on the market.
Adam and Eve chart pattern – Frequently asked questions (FAQ)

What is the Adam and Eve chart pattern?
The Adam and Eve pattern is a bullish and bearish reversal chart pattern. The pattern was first mentioned in the book Encyclopedia of chart patterns by Thomas Bulkowski. It’s a variant of the double bottom and double top patterns. Also, it’s a little bit different from the classic double top/bottom pattern.
What Does the Adam and Eve Pattern Indicate?
This chart pattern shows solid price levels and changes in market sentiment. When the asset price varies up and down, new highs and lows appear, defined by an Adm figure. That’s where the support and resistance occur.
What is a double-top Adam and Eve pattern?
A double top Adam and Eve are recognizable by its two peaks above the support line, also called the neckline. Once the first peak is reached, the buying current runs out of steam, and the price goes down to its support before rising again until reaching the second peak, which corresponds to the same level as the first.
How to interpret double-top Adam and Eve patterns?
The double top and double bottom always materialize in 4 distinct phases.
To see a double top, the first top will form (phase 1) during a strong uptrend. Then a first correction will take place, thus determining the neckline (phase 2). Then, the price of the asset will rise again and form a second peak (phase 3) relatively similar to the first before retracing the entire rise to break the neckline (phase 4). Once the latter has been crossed, the downward trend continues over the medium or long term.
How to interpret double-bottom Adam and Eve patterns?
To see a double bottom, the first dip occurs in a downtrend (phase 1) before a retracement sets in to retest the neckline (phase 2). This forms the first leg of the figure. Then the movement will repeat a second time with a drop (phase 3). Finally, a return to the neckline (second leg) again before crossing it to initiate a sustainable uptrend.


