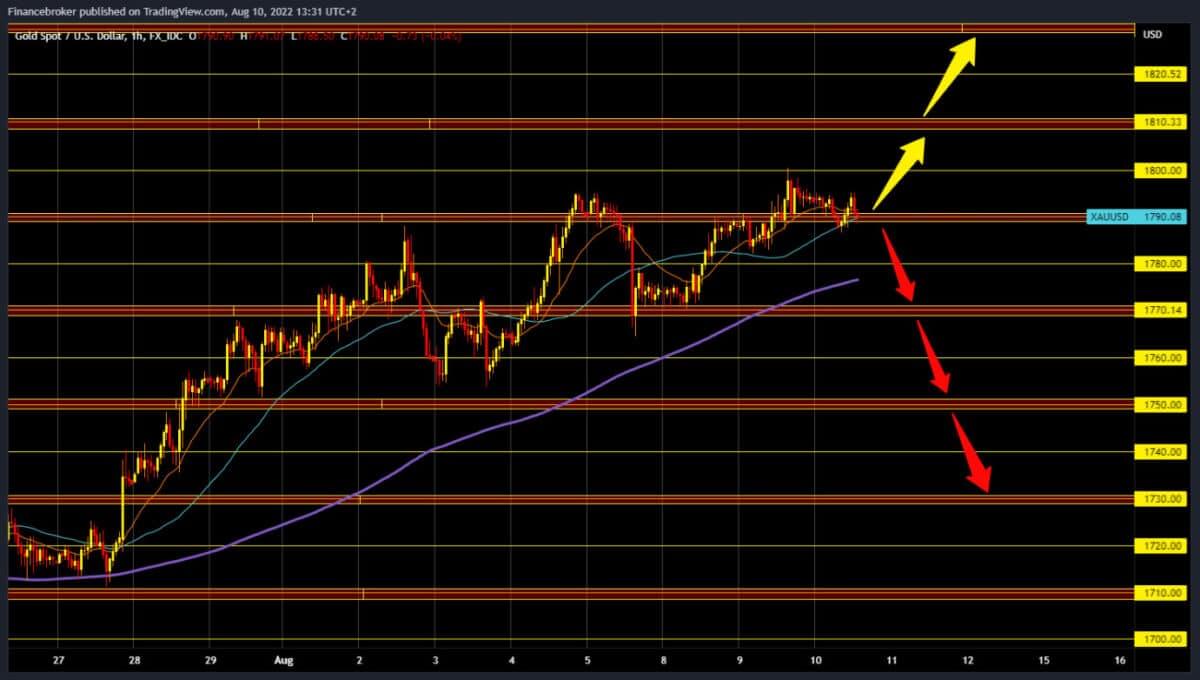
The price of gold has been stable in the last 24 hours, hovering around $1790. Yesterday we formed a new August maximum at $1795. Everyone is waiting for news on US inflation that awaits us before the start of the US session. Predictions are that the data will be weaker than expected, and such information could influence the Fed to reduce its aggressive policy of interest rate increases. This would be positive for the price of gold, and we could expect the price to return above the $1800 level. We need a negative consolidation and pullback below the $1790 level for a bearish option. Additional support awaits us in the zone around $1780 in the MA200 moving average. The price break below brings us down to the $1770 level. Potential lower targets are $1760 and $1750.
Silver chart analysis
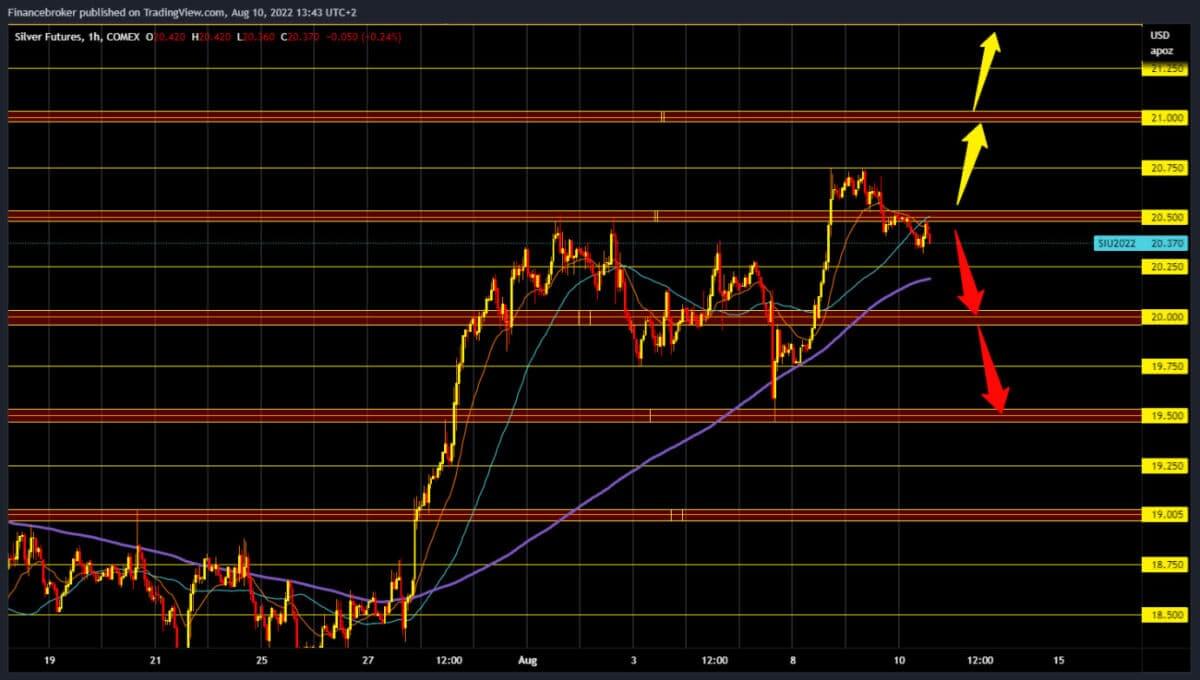
The price of silver retreated from yesterday’s high to $20.75. During the Asian trading session, the price pullback continued, and a lower high was formed at $20.50. Then the price tried to make a break above, but it only did a retest of the breakout place and now continues towards the $20.25 level. Additional support in that zone is in the MA200 moving average. Potential lower targets are $20.00, $19.75 and $19.50 levels. For a bullish option, we need a positive consolidation and a return above the $20.50 level. After that, we could once again test the $20.75 level. A potential higher target is the $21.00 level.
Market overview
Stocks and bonds were flat on Wednesday without major swings. At the same time, the dollar weakened ahead of the release of US inflation data that could signal the Federal Reserve’s move to raise interest rates more aggressively. Today’s inflation data follows last week’s strong US jobs report. The jobs report eased fears of a near-term recession but suggested the economy still needs some slowing.