ApeCoin und Akita Inu: ApeCoin fiel wieder unter 1.400
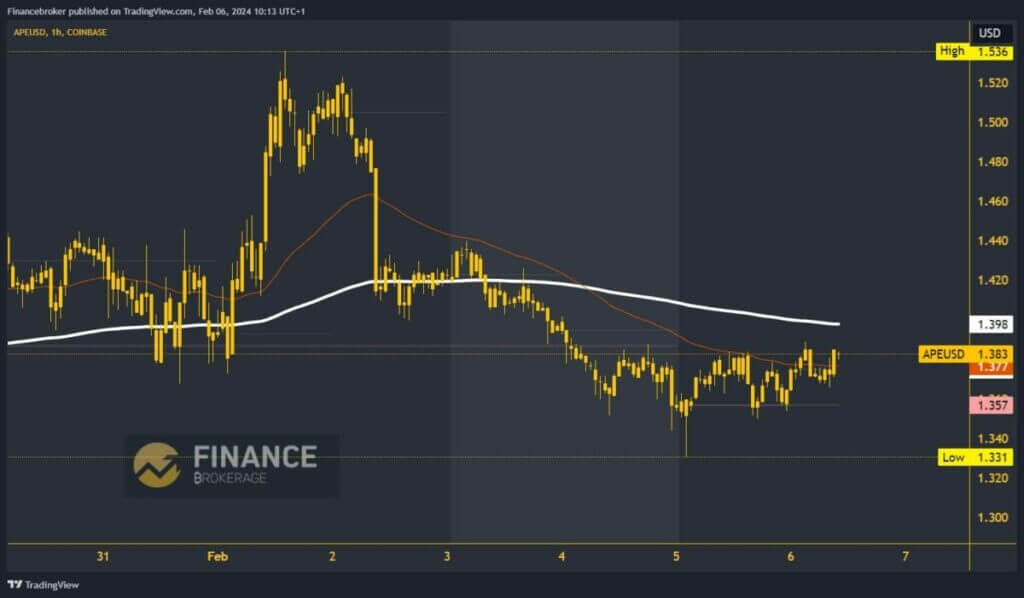
- Der Preis von ApeCoin fiel am Montag auf 1.331 Punkte und bildete damit ein Sieben-Tage-Tief.
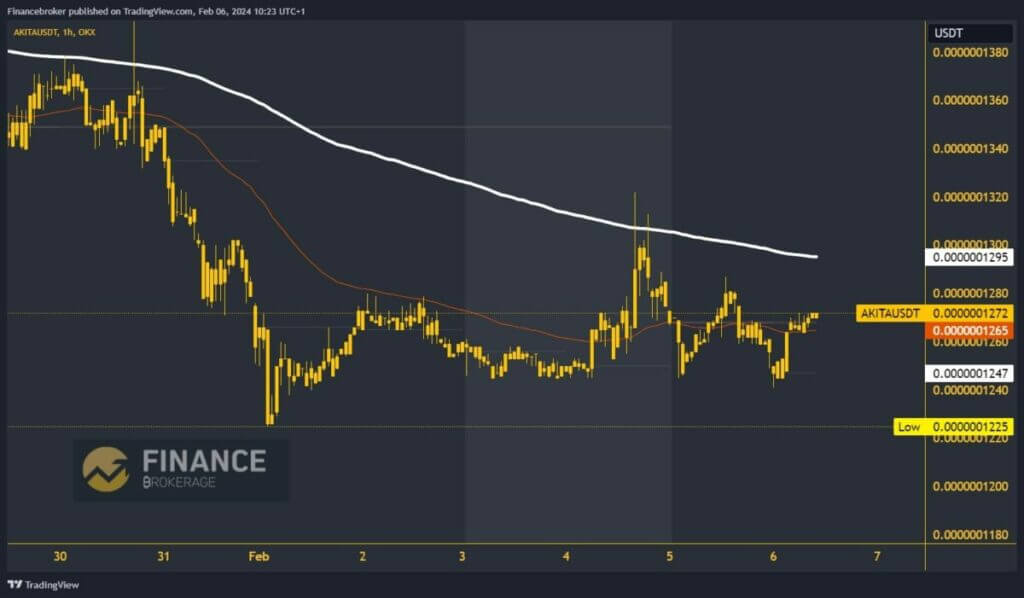
- Der Akita Inu-Preis ist der sechste Tag in der lateralen Konsolidierung im Bereich von 0.0000001225-0.0000001300.
ApeCoin-Chartanalyse
Der Preis von ApeCoin fiel am Montag auf 1.331 Punkte und bildete damit ein Sieben-Tage-Tief. Nachdem wir Unterstützung erhalten hatten, sahen wir einen Anstieg über die Marke von 1.350 Punkten. Von dort aus beginnt der Preis eine bullische Konsolidierung, die uns auf 1.382 Niveaus bringt. Wir erwarten eine Fortsetzung und einen Anstieg auf 1.400 und den gleitenden Durchschnitt des EMA200. Durch die Überwindung dieser Widerstandsniveaus hätte ApeCoin die Möglichkeit, eine Erholung einzuleiten und sich auf höhere Niveaus zu bewegen.
Mögliche höhere Ziele sind die Niveaus 1.420 und 1.440. Wir müssen zur Unterstützungszone bei 1.350 zurückkehren, um eine rückläufige Option zu erhalten. Ein Rückgang nach unten führt uns zu einem Test des gestrigen Tiefs. Neuer Druck in dieser Zone könnte sich negativ auf den Preis auswirken und einen weiteren Rückgang einleiten. Mögliche niedrigere Ziele sind die Niveaus 1.320 und 1.300.

Akita Inu chart analysis
Akita Inu price is the sixth day in the lateral consolidation in the 0.0000001225-0.0000001300 range. During the weekend, the price tried to break the upper resistance level, but the attempt ended without success. In that zone, the additional resistance is EMA200, and this caused the price to reject and start a retreat to the 0.0000001240 support level. Today’s picture shows a bullish consolidation from the support level and recovery to the 0.0000001270 level.
The price is in a stable daily bullish trend, and we expect to move above the 0.0000001280 level. There, we would be within reach of the 0.0000001300 level and the EMA200. Potential higher targets are 0.0000001310 and 0.0000001320 levels. We need a negative consolidation to the previous support level for a bearish option. Falling below would extend the previous bearish trend.


