
Gold and Silver: Stability
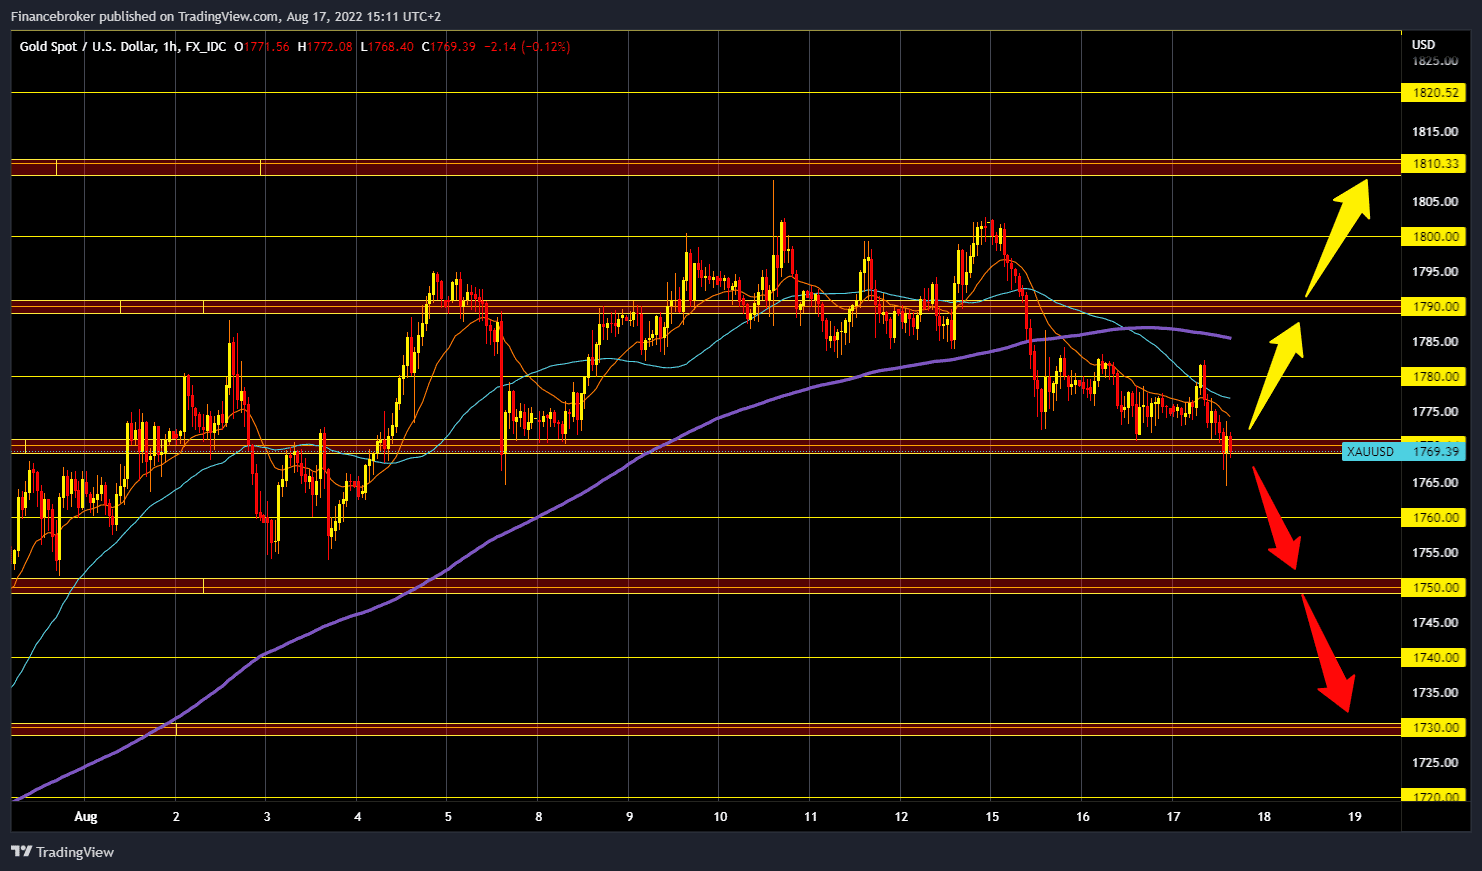
- The price of gold has been moving in the range of $1770-1780 for the second day.
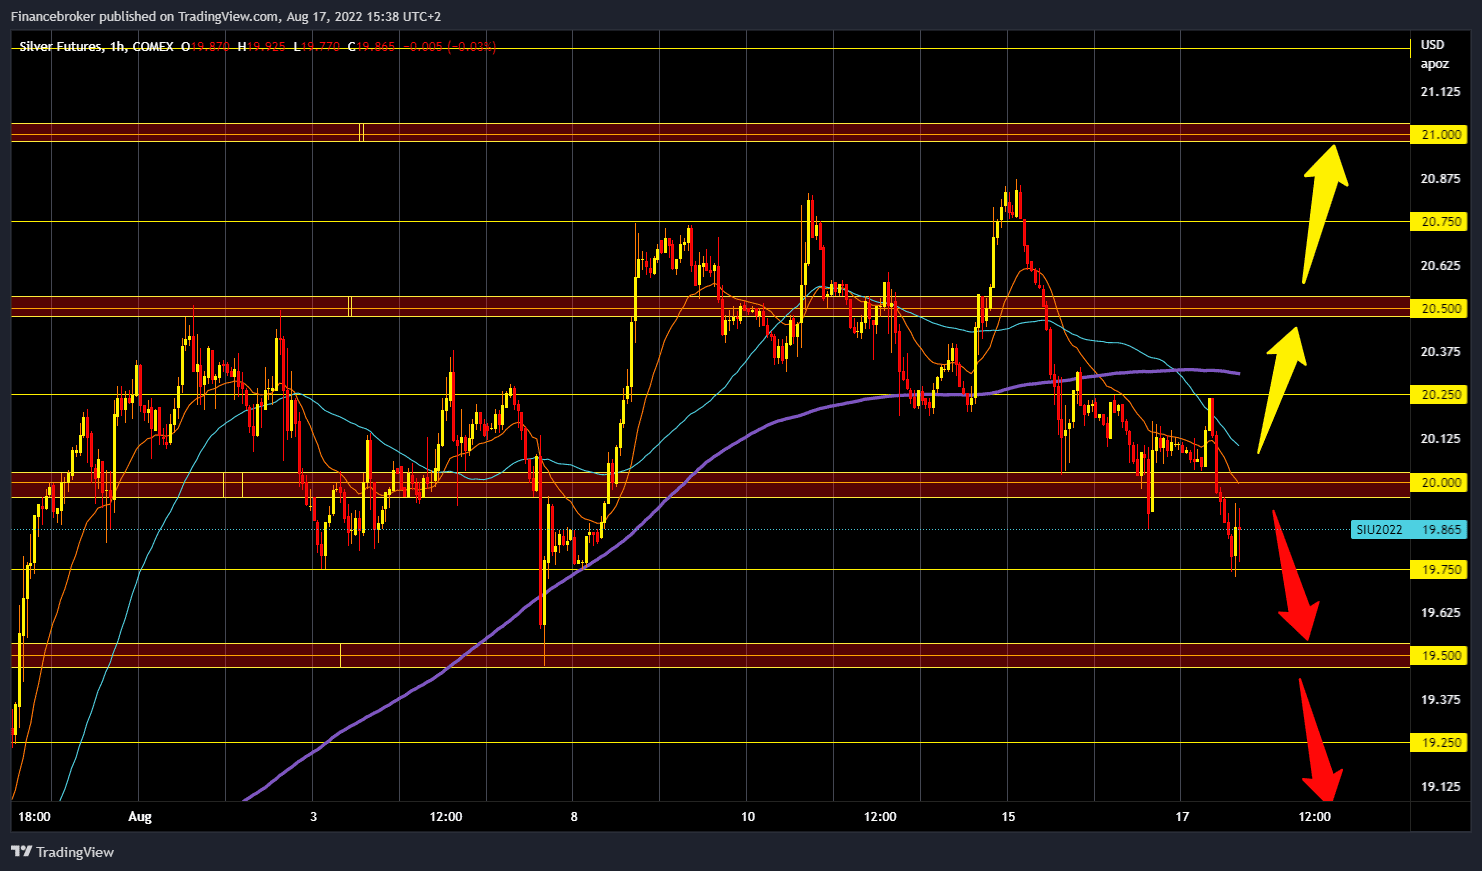
- The price of silver tried to climb above the $20.25 level during the Asian session but without success.
Gold chart analysis
The price of gold has been moving in the range of $1770-1780 for the second day. During the Asian session, the price of oil was stable, and in the European session, we see an increase in bearish pressure on the $1770 support zone. At one point, we fell to the $1765 price but quickly pulled back up to the $1770 support zone. Our moving averages are now on the bearish side. For a bullish option, we need a new positive consolidation and a return above the $1780 level. Then we need to hold there in order to move towards the $1790 level. Potential higher targets are $1800 and $1810 levels. We need a continuation of this negative and a pullback towards the $1760 level for a bearish option. Potential lower targets are the $1750 and $1740 levels.
Silver chart analysis
The price of silver tried to climb above the $20.25 level during the Asian session but without success. A bearish consolidation followed, and the price fell to $19.75. We currently have some support there, but there are increasing chances that we will see a drop to the $19.50 level. We need a continuation of the negative consolidation and a decline to the $19.50 support for a bearish option. If we fail to hold on to that level, the price of silver will continue its retreat towards the $19.25 and $19.00 levels. For a bullish option, we need a new positive consolidation and a return above the $20.00 level. Then the price must stabilize at that level in order to continue further to the $20.25 level. Additional resistance at that level is the MA200 moving average. Potential higher targets are $20.50 and $20.75 levels.
Market overview
FOMC minutes await us tonight, which are likely to strengthen the hawkish stance given the previous financial events and results in recent weeks.