


USDRUB, EURUSD, GBPUSD and AUDUSD chart overview
USDRUB chart analysis
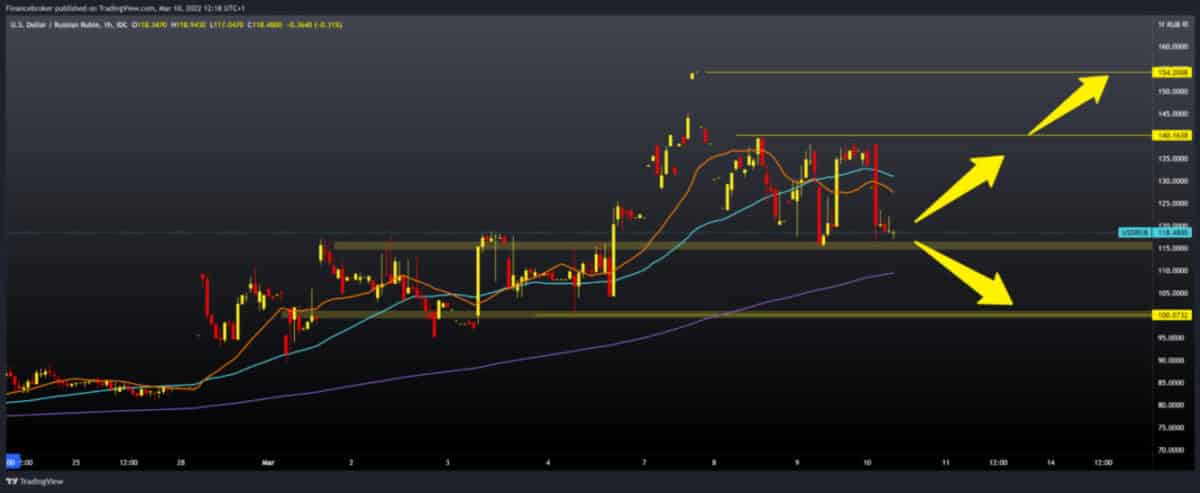
The last two days, the pair moving in the range of 115,000-140.00, we are now testing the lower support zone. The Russian ruble is slowly stabilizing, and this pressure could make a break below this support zone and send us to the next support zone, 100,000-105,000.
The MA20 and MA50 are now on the bearish side, while our MA 200 is in the zone of around 110,000, where we can expect the first potential support. Greater psychological support is at 100,000 levels.
If we are waiting for the bullish option, we need a new positive consolidation and at least a jump above 130,000 in order to expect the pair to continue towards the 140,000 resistance zone. After that, our target is 154,200 historically high, and if the crisis continues around what is happening in Ukraine, we can easily see the formation of a new historical maximum.

EURUSD chart analysis
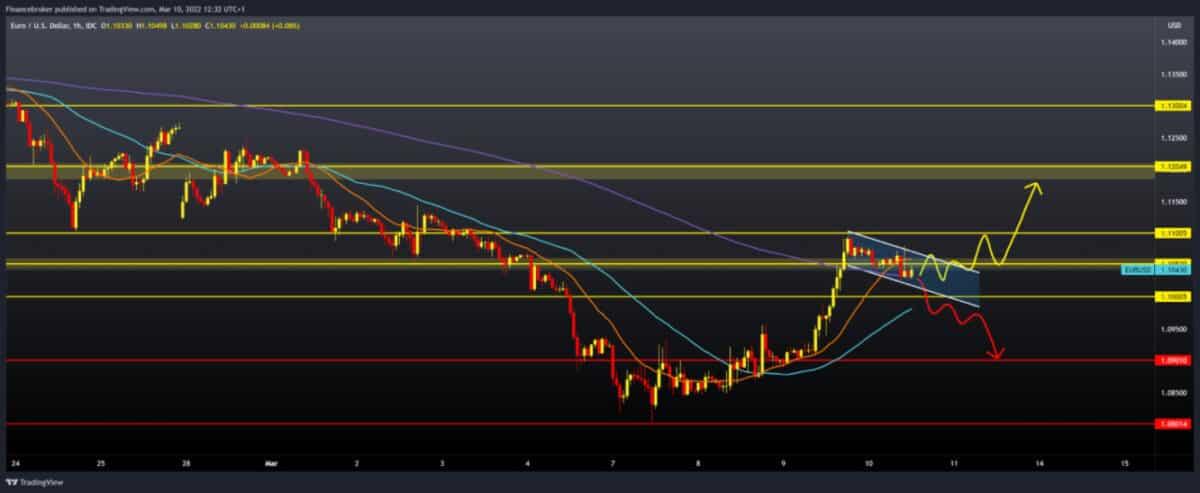
Pair EURUSD yesterday managed to form this week’s maximum by jumping to 1.10960. After that, we have a smaller bearish consolidation to 1.10280, where we are now.
The EU imposed additional sanctions on Russia yesterday, which could have a negative impact on the euro, unlike the dollar, which is considered a safer currency. If we are considering a bullish option, EURUSD must make a break above 1.11000. With the support of all moving averages, we continue on to the next potential resistance at 1.12000.
We need a continuation of this negative consolidation from yesterday for the bearish option. Then we need a break below 1.10000 and an MA50 moving average. Then we expect increased bearish pressure and the potential to revisit the previous support zone from the beginning of the week 1.08000-1.08500.

GBPUSD chart analysis
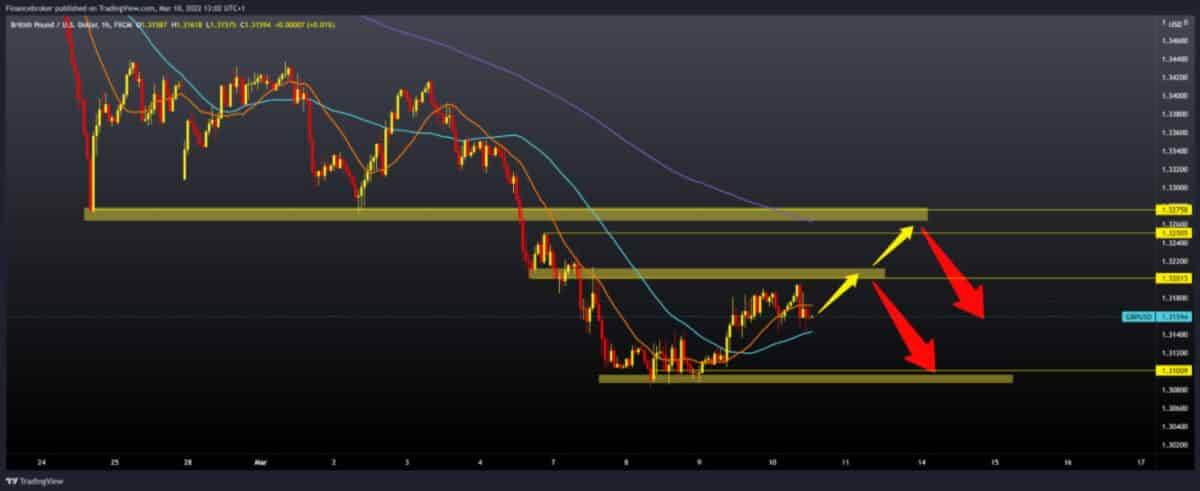
Pair GBPUSD stopped at 1.31940 this morning and made a quick pullback to 1.31410, where he found current support. Now we hope that the pound will be able to find better support here, consolidate and try to break above the 1.32000 resistance zone. If that happens, our first target is 1.32500. Additional resistance at that level may be our MA200 moving average, and the next resistance at 1.32760, the February support zone, which is now our potential resistance. A break above could climb a pair above 1.33000. For the bearish option, we need a continuation of today’s negative consolidation and a retreat below 1.31400. Below we descend to 1.31000 this week’s podium zone. Any news about the events around Ukraine will probably have an impact on this chart as well.

AUDUSD chart analysis
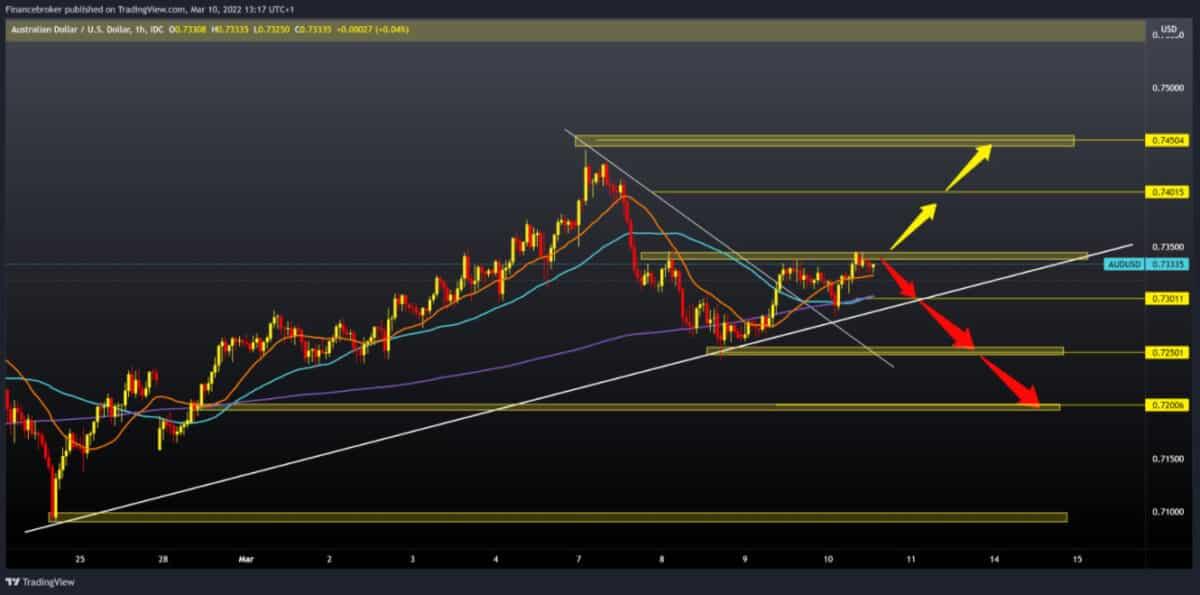
Pair AUDUSD is currently facing an obstacle at 0.73500, and now we have a smaller pull to support at 0.73250.
Looking at moving averages, they are on the bullish side in a range from 0.73000-0.733000. We need a new break above 0.73500 in order to be able to continue up to 0.74000, then to the previous high at 0.74500.
We need to continue this negative consolidation and pullback below the MA20 moving average for the bearish option. Then we come to 0.73000 support and MA200 moving average, and our potential additional support is the lower trend line. Break AUDUSD below the support line, lowering us to the previous low at 0.72500, then to 0.72000.

Market overview
The ECB will take a more cautious approach than earlier expected, as the ongoing conflict in Ukraine has changed the economic scenario.
The bank is likely to keep its main refinancing rate at zero, the deposit rate at -0.50 per cent and the marginal interest rate at 0.25 per cent.
An hour later, ECB chief Christine Lagarde is holding a press conference in Frankfurt on the next steps to strengthen the EU bloc’s economy.
-
Support
-
Platform
-
Spread
-
Trading Instrument

