USD/JPY forecast for January 5
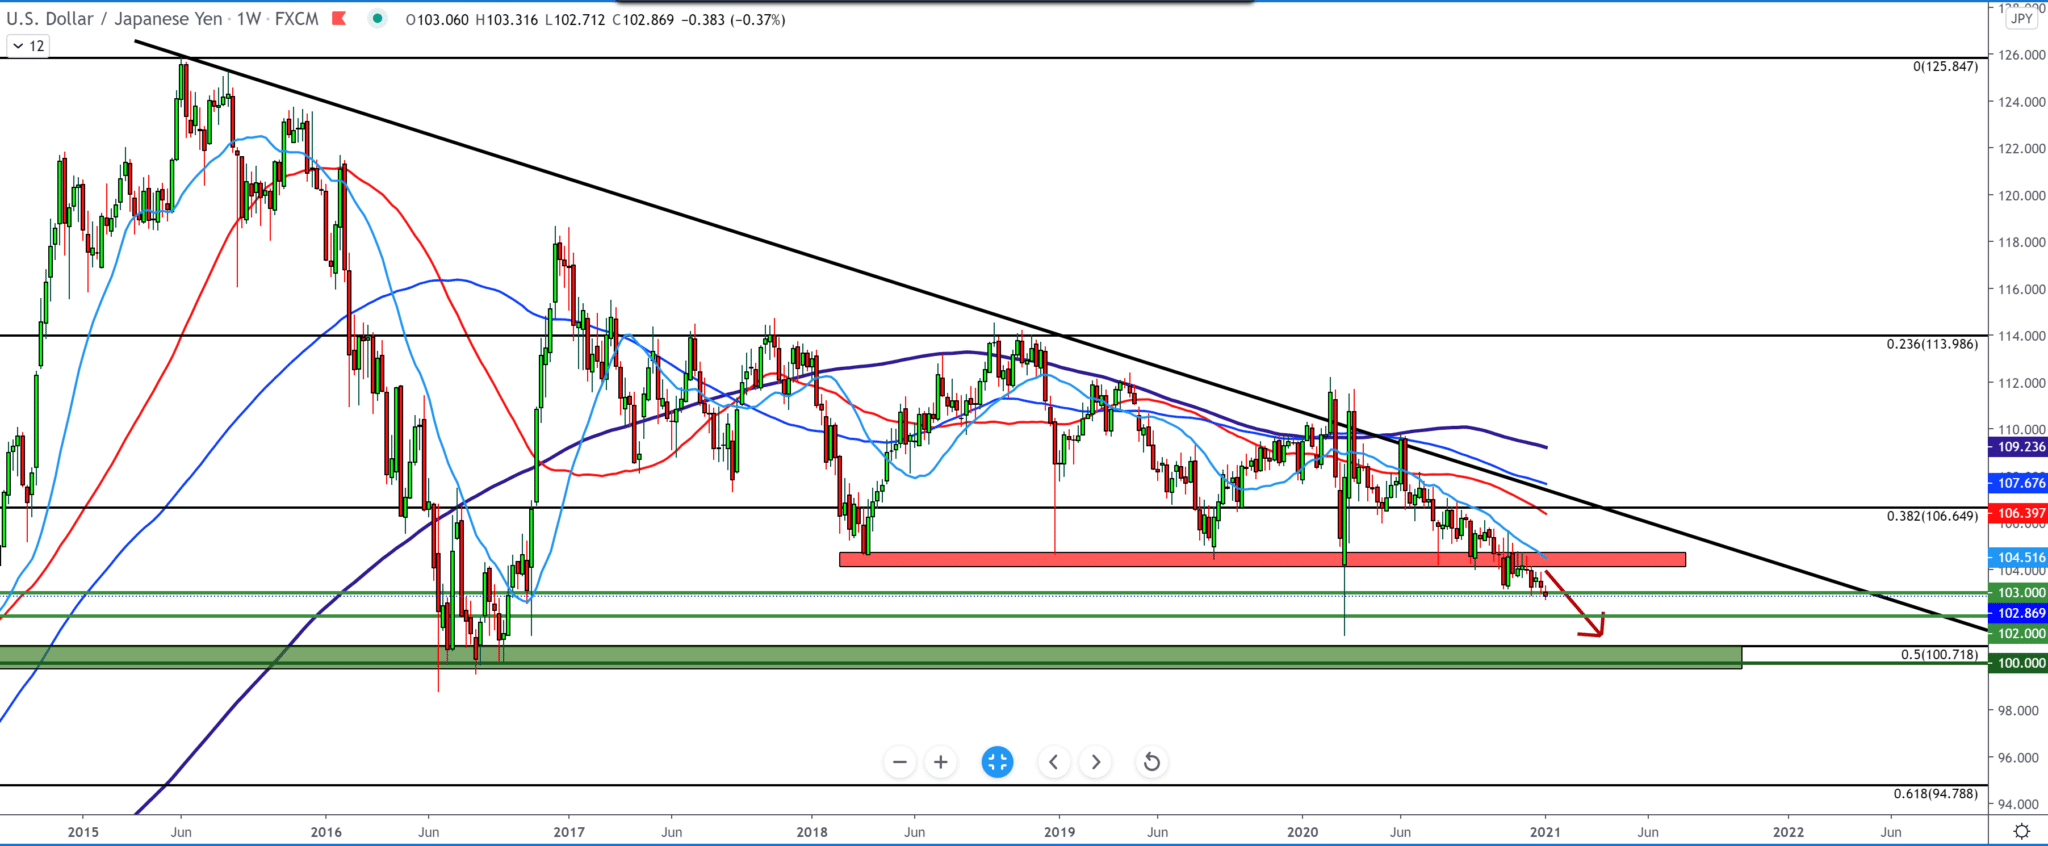
Looking at the chart on the weekly time frame, we see a bearish trend in the coming period. The dollar has been under pressure for a long time, while the Japanese yen has always been a safe currency for investors, especially now due to the global coronavirus pandemic. On the chart from the top, we see the long-term trend line as resistance and moving averages that are proof of the continuation of the bearish trend, even the smallest MA20 (light blue line) represents the dollar’s resistance.

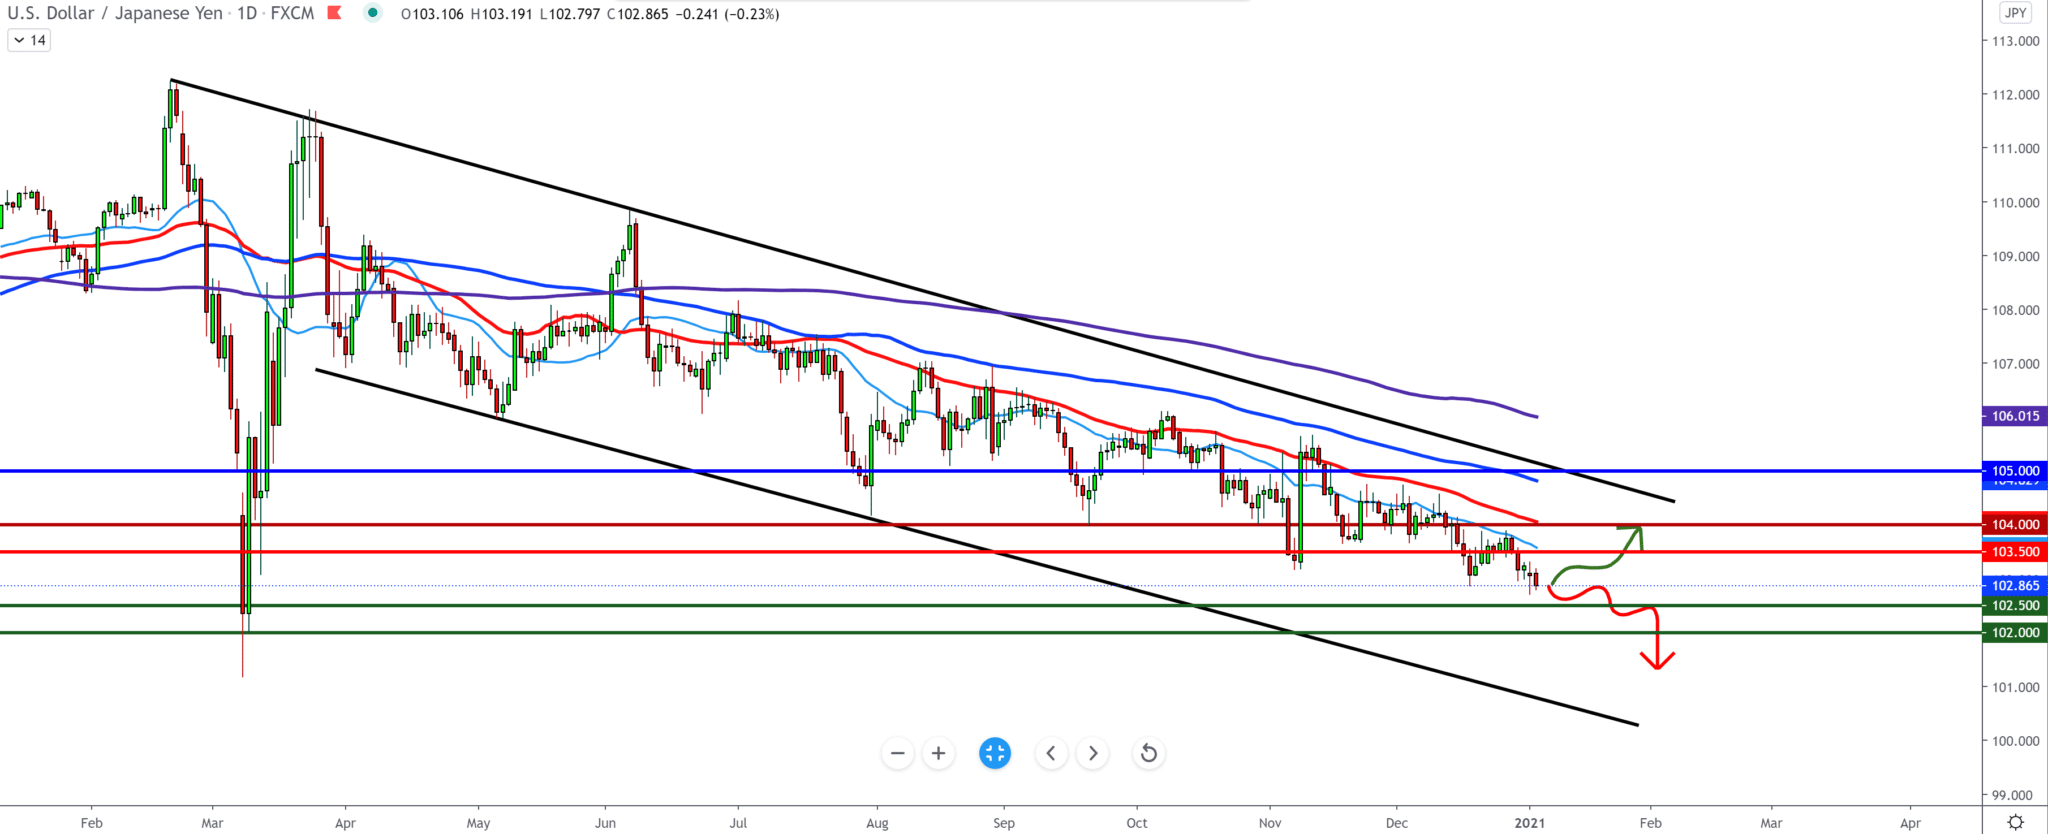
On the daily name frame, we see that the bearish trend is still in effect with the support of all moving averages from above. The MA100 (blue line) is great resistance to steam while the MA20 and MA50 are being tested for now but resist, and we have no break above them. Now we need to pay attention to how the couple behaves at certain levels. below we have the following psychological support at 102,500 and 102,000 direct burns to 100.00. The above resistances match our moving averages at 103,500, then at 104,000.

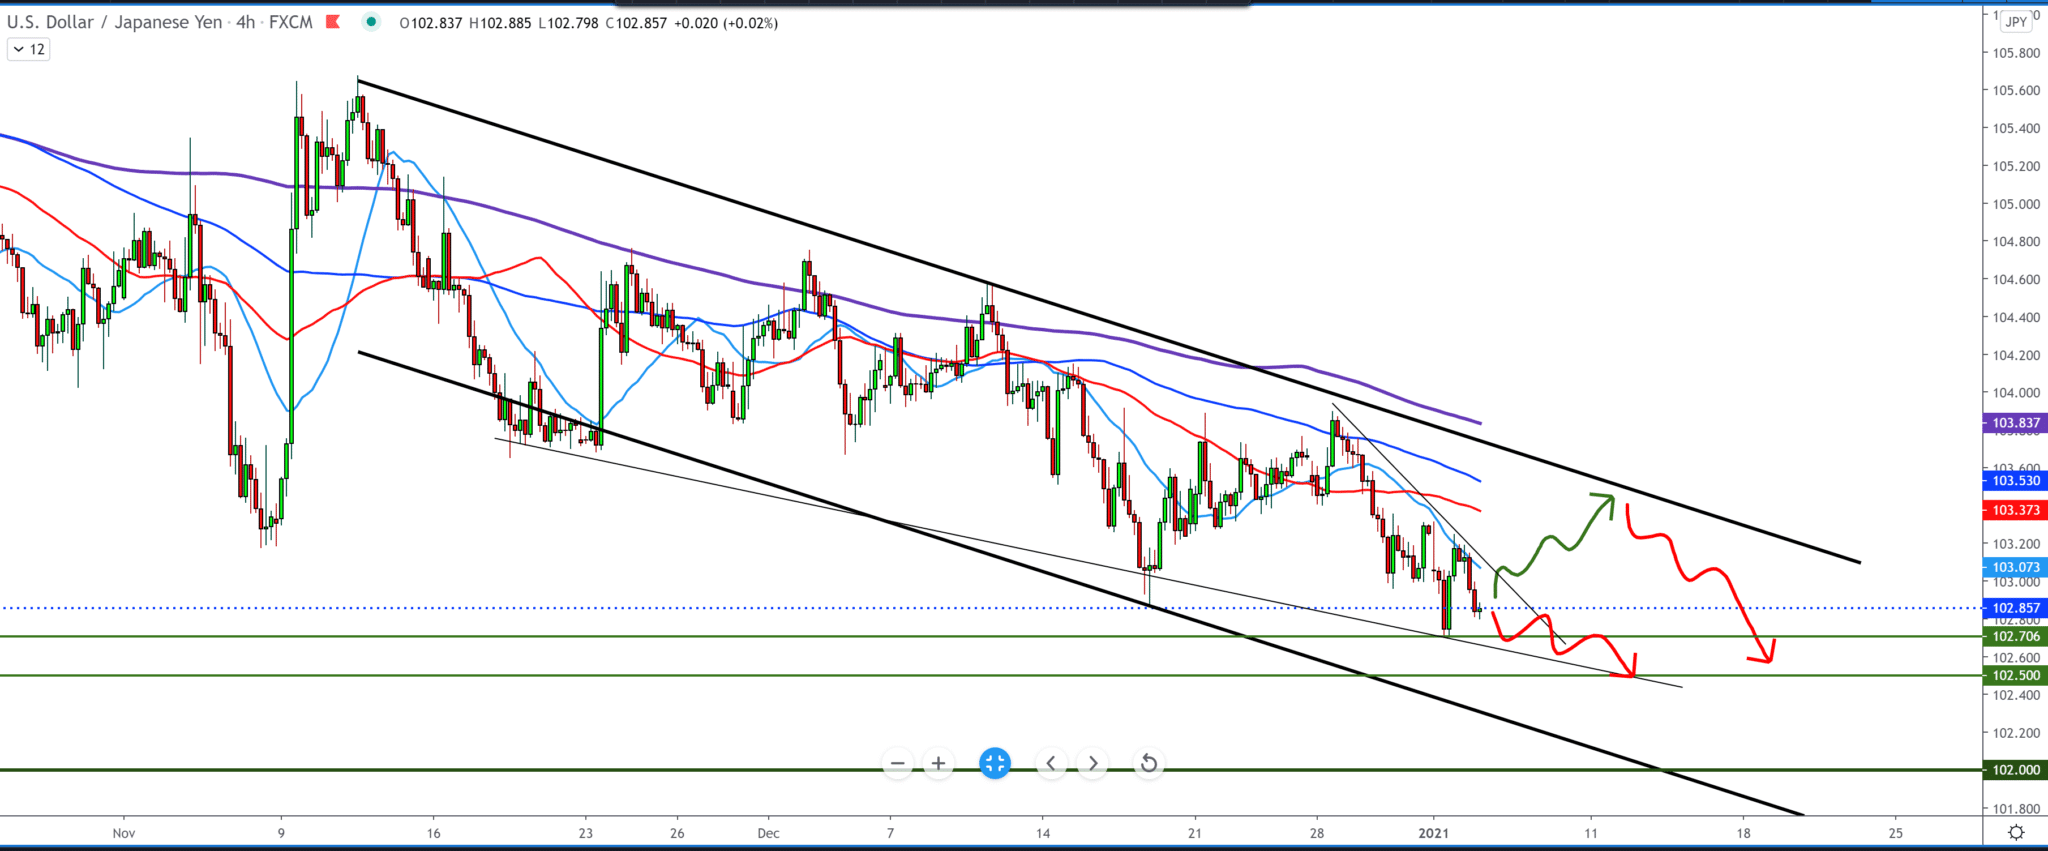
On the four-hour time frame, we see that the pair moves in a descending channel with a smaller pullback to the upper edge and resistance in the form of moving averages. Now again, in this time frame, there is a chance to see another pullback to the top edge of the channel and then pay attention to a possible break or bounce back down to the lower levels. A break below the previous low at 102.70 may sign us to continue the bearish trend. And a bounce up and a break above 103.00 and a lower trend line with MA20 support (light blue line) is a sign of a short-term pullback.

-
Support
-
Platform
-
Spread
-
Trading Instrument


