

TRADING: TOPS AND BOTTOMS, Chapter 3
In a VSA charting, the trend channels’ highs and lows possess their own significance. Below are the points that can be applied to any chart.
On one hand,
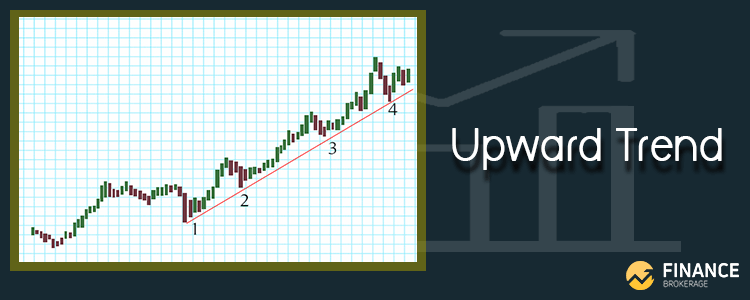
- The strength of a medium-term sign can be seen through the consecutive higher bottom where every significant low point in the chart is above than the former one.
- The strength of a short-term sign can be seen through consecutive higher lows, where every daily bar’s low is above than the former one. This action illustrates the support of professional money on the movement.
Check out this chart below, as you can see there is a distinct upward trend. Further, this also showed how both of the principles put at work.
On the other hand,
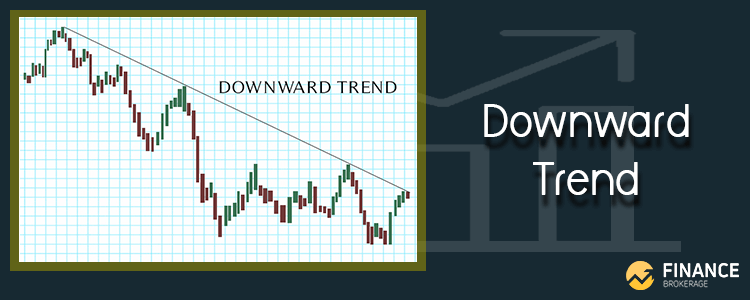
- The weakness of a medium-term sign can be seen through consecutive lower tops where every significant high point is below than the former one.
- The weakness of a short-term sign can be seen through consecutive lower highs, where every daily bar’s high is below than the former one. This action illustrates the absence of support for professional money on the movement.
The first indication that you have a potential trend change is when you see the first lower up in a bull move and the first higher bottom in a bear move.
There are several chart patterns that show the possible emergence of a trend reversal. The head and shoulders double or triple tops, the cup and handle are some of the visible patterns. The cup and handle present a rounded top or bottom which is more tradable.
During an uptrend, the price halts, and reverses, as well as the double or triple times occurrence of the same price collectively construct the double and triple tops. This shows the installation of momentum as the price is unable to produce “higher highs.” Moreover, this could only gather a parallel to the previous rally.
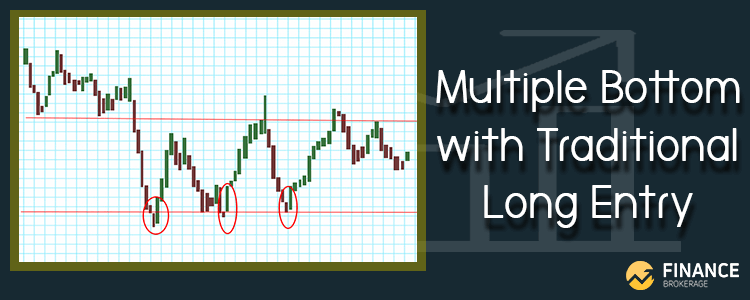
During a downtrend, a double and triple bottom might emerge when there the price places double and triple times at the same area, however; fails to go above that area. This also manifests that the downtrend is a losing team.

The traditional way of trading using this pattern is to sell short when the price places below the retracement lows in the middle of the double or triple tops. Also, you can also buy when there’s a price rally above the retracement highs in the middle of double or triple bottoms.
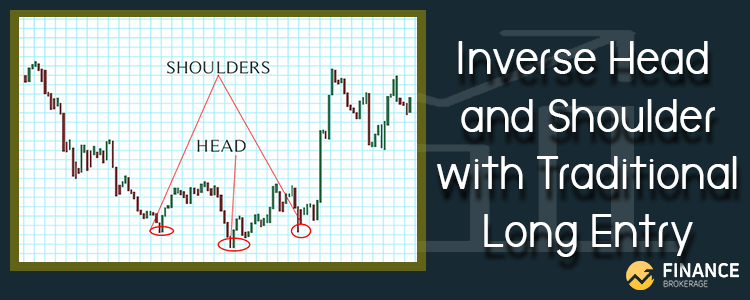
A sign of a slow trend could be seen when there are the head and shoulders and inverse head and shoulders. During an uptrend, the formation of head and shoulders occurs when the price places make a higher high followed by a lower high.
Meanwhile, the formation of inverse head and shoulders occurs during a downtrend when the price makes a lower low then followed by a higher low. This, consequently, makes the creation of three points mimicking a shoulder, a head, and another shoulder’s appearance.

In this pattern, selling a short when the price places below the retracement lows is its traditional way. Another way could be buying a short when the price rallies, within an inverse head and shoulders pattern, above the retracement highs. Most of the time, the lows and highs within the pattern can be connected. This would form a trendline which is called the neckline. There would be an entry which can be taken during the movement of price through the neckline.
Another reversal pattern is the cup and handle. The bottoming pattern is more popular compared to a cup and handles topping pattern in the stock market. The formation of this pattern occurs when there’s a slow decrease then, would be creating a rounded bottom form. The price rallies to a section where a decrease started, pauses or pulls back. Then, it would proceed to draw near higher again. When the price breaks exceeding the formation’s handle, then a long trade would be taken after.
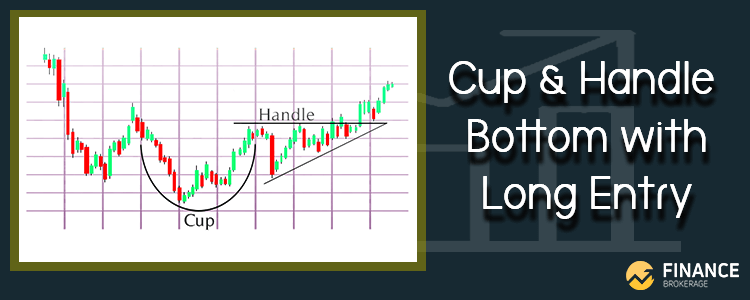
Chart patterns prove for a potential reverse. By the time that chart pattern’s signals occur, a potential reverse might happen and a top or bottom will take place.

Here are some tips that you may want to use:
– Old trend lines may be used in successfully locating support and resistance most especially when these trends are clustered.
– You may also want to compare two or more time frames. You can see trending across a longer and shorter timeframe.
– Remember to avoid interpreting trend lines mechanically. Instead draw the trend lines mechanically, however; do not interpret them in a strict fashion. They should serve as an instrument.
– The potential resistance’s movements are represented through trend lines. Bear in mind the specialist or market-makers take efforts to penetrate resistance. It is a common knowledge that the market takes the least resistance’s track. The areas of resistance are indications whether the line will last or not.

