The Bitcoin and Dogecoin, bearish trend still on the chart
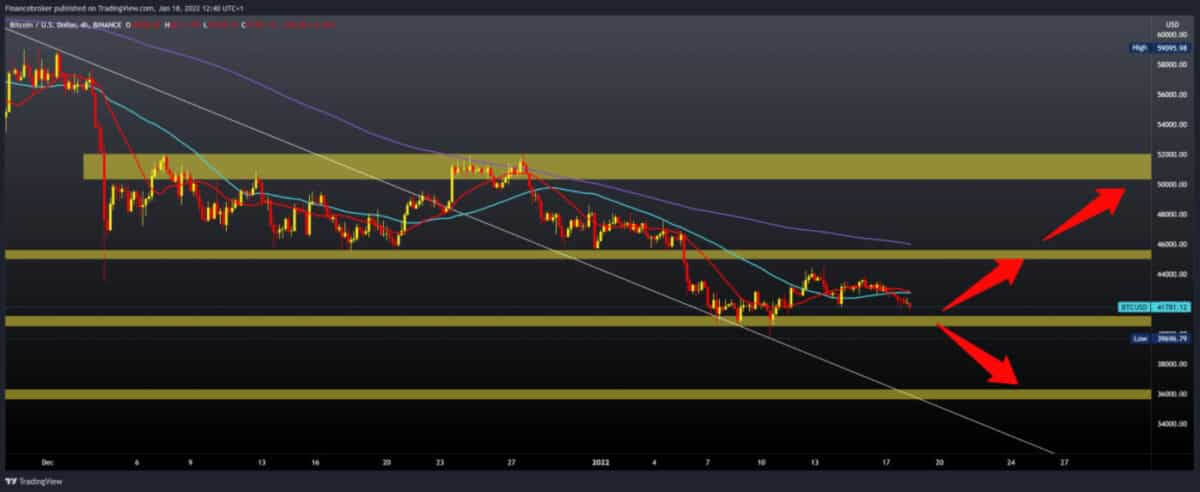
Bitcoin chart analysis
The price of Bitcoin is still in crisis, and the price continues to rise from $ 44,000 to the current $ 41,790. We are getting closer to the psychological support zone at $ 40,000. Again, we are under bearish pressure of MA20 and MA50 moving averages that are directing us towards lower Bitcoin prices.
Bullish scenario:
We need a new positive consolidation that would reverse this trend and send the price of Bitcoin to higher levels.
We also need a break above $ 43,000 to support the MA20 and MA50 moving averages.
Then again, we came across the $ 44,000 zone, an obstacle in our previous attempt.
If Bitcoin breaks above, the next resistance zone awaits us at $ 46,000.
Additional resistance at that level awaits us in the MA200 moving average.
Bearish scenario:
We need to continue this negative consolidation, which would bring us down to testing the psychological level at $ 40,000.
With the continuing bearish pressure, we can expect further price reductions below this level.
Our next psychological support is at $ 30,000, and we were there half a year ago, the last time in July. Increased fear in the crypto market can easily bring us down to that level.
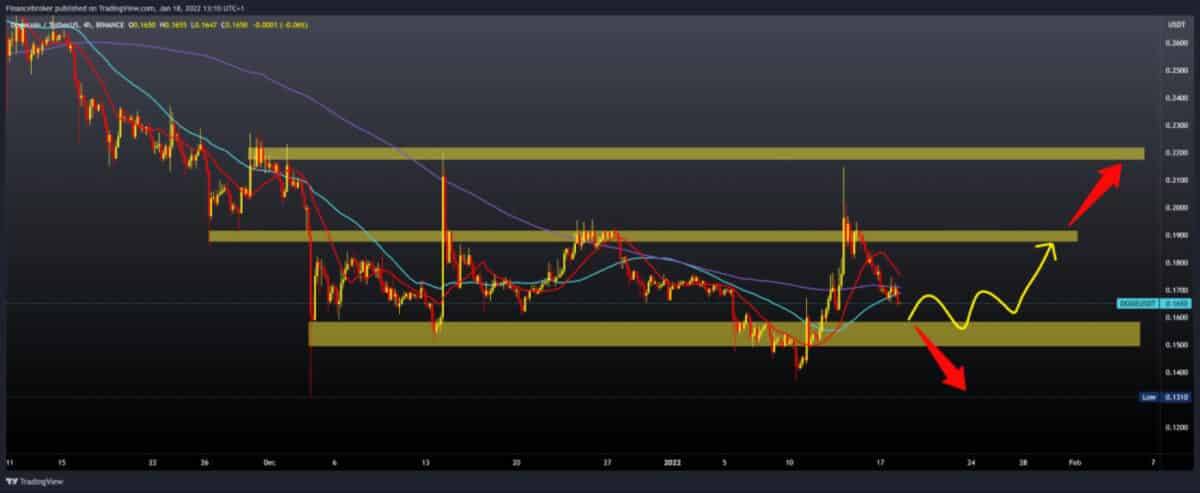
Dogecoin chart analysis
The price of Dogecoin is in a bearish trend after it reached the level of 0.21500 on January 14. After that, we have a price retreat to the current 0.16500. Now we are looking at the support zone 0.15000-0.16000 as a potential obstacle to the continuation of the bearish trend.
Bullish scenario:
We need a new positive consolidation, that will pull us back to the bullish side.
We need a new break above 0.17000 to bring extra support in the MA50 and MA200 moving averages.
At 0.18000, we come across the MA20 moving average, and we need a break above to try to compromise the 0.20000 psychological level.
Bearish scenario:
We need the continuation of this negative consolidation and the further withdrawal of the price to the support zone 0.15000-0.16000.
We can expect greater consolidation in that zone. If bearish pressure continues, we will definitely see the price continue to fall to lower levels on the chart.
The break below could take us to the December low at 0.13100.
Market overview
Crypto markets are losing $ 100 billion a day as bitcoin has fallen below $ 42,000. Unfavorable bitcoin movements continue, with assets falling below $ 42,000. Most altcoin is in an even gloomier situation, with significant losses from Ethereum, Binance Coin, Avalanche, MATIC, LUNA, ATOM, and others. It is safe to say that the past few days have not been the best for the primary cryptocurrency. On January 15, it jumped to just $ 44,000 after an impressive raise. However, he failed to cross that level as the bears tightened their grip on the market. BTC first fell to $ 43,000 hours later, before another drop in prices led to about $ 42,000, was announced yesterday. While bitcoin stayed there for a while and seemed to be able to maintain that level, the bears once again pushed it south. In the following hours, BTC fell to about $ 41,500, the lowest weekly level. It initially bounced to above $ 42,000 but again failed and is currently at that level. As a result, its market capitalization fell below $ 800 billion.