
S&P 500 Correction – No Need to Hold On To Your Hat
Yesterday‘s bearish price action in stocks seemed shallow and the largely sideways correction I was looking for. Not an enthusiastic follow through – just rocking the boat while the S&P 500 bull run goes on. Stocks are likely to run higher before meeting a serious correction.
As I argued in yesterday‘s detailed analysis of the Fed policies, their current stance won‘t bring stocks down. But it‘s taking down long-term Treasuries, exerting pressure on the dollar (top in the making called previous Monday), and fuelling commodities – albeit at a very different pace. The divergencies I have described yesterday center on a weak gold performance – not gaining traction through the monetary inflation, instead of trading way closer in sympathy with Treasury prices.
Gold has preceded the other commodities through the corona deflationary shock and is waiting for more inflation signs. It didn‘t make the final top in Aug 2020, and a new bear market didn‘t start. It‘s my opinion that thanks to the jittery Treasury markets, we‘re seeing these dislocations. Once the Fed focuses on the long end of the curve in earnest, that would remove the albatross from gold‘s back.
I can‘t understate how important the rising yields are to the economy. Since 1981, we‘ve been in one long bond bull market, and now we are approaching the stage of it getting questioned. The rates are rising without the economy growing stronger, far from its potential output, and characterized by a weak labor market. There are no signs of overheating, but we‘ll get there later this year probably.
It‘s like generating inflation – the Fed policies, for all their intent, can‘t command it into happening. The Treasury market is throwing a fit, knowing how much spending (debt monetization) is coming its way. Moreover, the Fed‘s focus is surely shifting to yields at the long end. Bringing it under control would dampen the rampant speculation in stocks. As well as lift gold while not hurting commodities or real economic recovery. It sounds like a reasonable move (yield curve control), and I believe they‘re considering it as strongly as I am talking about it.
Previous Gold Observations
Let‘s quote yesterday‘s special report on gold, inflation, and commodities:
(…) the wave of new money creation (we‘re almost at double the early 2020 Fed‘s balance sheet value – $4T give or take then vs. almost $7.5T now ) keeps hitting the markets, going into the real economy, predictably lifting many boats. I believe that we will experience a stock market bubble accompanied by the precious metals and commodities one – to a degree, simultaneously, for the stock market is likely to get under pressure first. Again, I am talking about the big picture here – not the coming weeks.
Let‘s examine the bear market is gold – some say that the late 2015 marked bottom, I‘m of the view that the 2016 steep rally was the first proof of turning tide. But the Fed got serious about raising rates and shrinking its balance sheet. So, gold reached the final bottom in Aug 2018. Seeing through the hawks vs. dove fights at the Fed in the latter half of 2018 (December was a notable moment when Powell refused to the markets‘ bidding, remained hawkish before relenting).
Since then, gold was slowly but surely gathering steam, and speculation in stocks was on. The repo crisis of autumn 2019 didn‘t have a dampening effect either – the Fed was solidly back to accommodative back then. These have all happened well before corona hit – and it wasn‘t able to push gold down really much. The recovery from the forced selling, this deflationary episode, was swift. Commodities have clearly joined, and the picture of various asset classes taking the baton as inflation is cascading through the system is apparent.
Let‘s get right into the charts (all courtesy of www.stockcharts.com).
S&P 500 Outlook and Its Internals

Finally, a daily downswing – not meaningful, but it‘s as good as it gets. The slightly lower volume shows no raging conviction but instead that this sideways move is over.
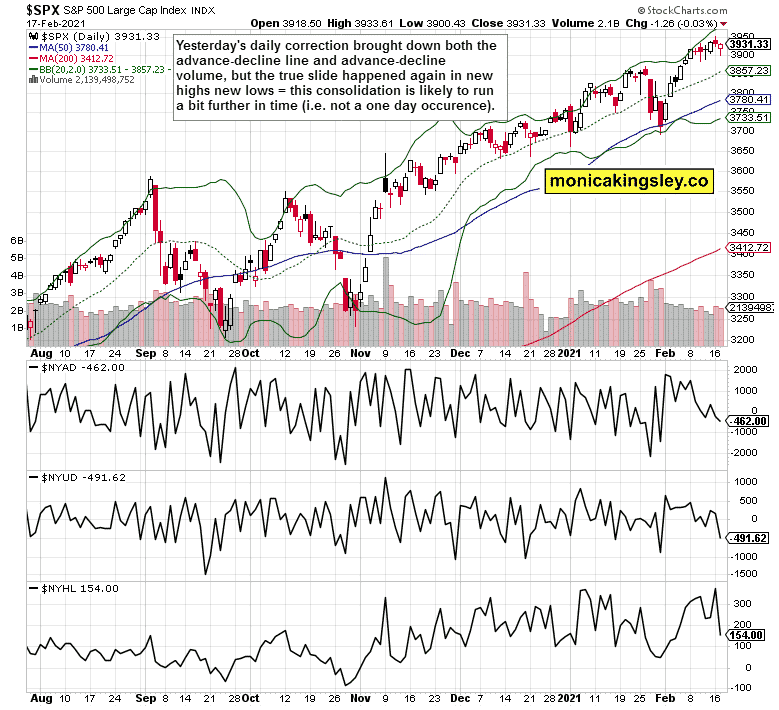
The market breadth indicators aren‘t at their strongest. Both the advance-decline line and advance-decline volume dipped negative. That isn‘t worrying unless you look at new highs new lows as well. While still positive, $NYHL is showing a divergence by moving below the mid-Feb lows. Seeing its decline to carve a rounded bottom at the end of Jan would be a welcome sight to the stock bulls. Before then, nothing stands in the way of muddling through in a shallow, corrective fashion.
Credit Markets and Treasuries
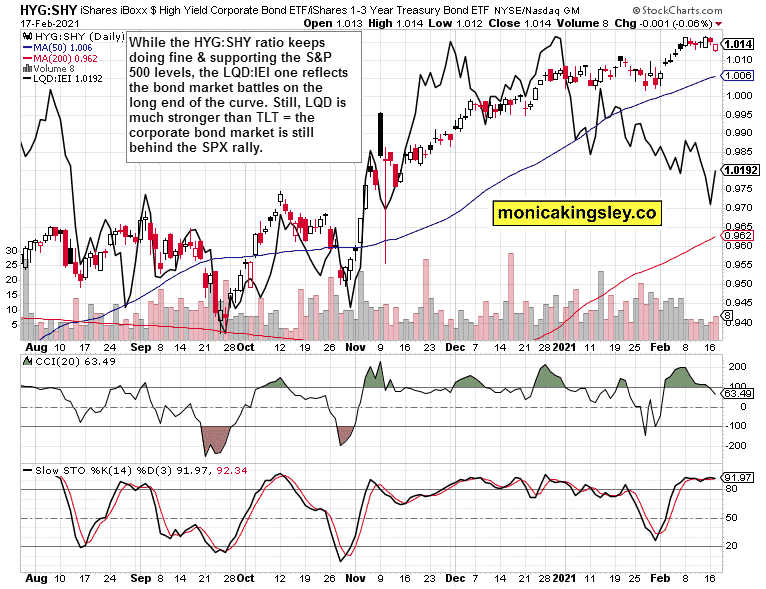
The divergence in both leading credit market ratios – high yield corporate bonds to short-term Treasuries (HYG: SHY) and investment grade corporate bonds to longer-dated Treasuries (LQD: IEI) – show the bond market strains. HYG: SHY clearly supports the S&P 500 rally, while LQD: IEI isn‘t declining in tandem with long-term Treasuries. Instead, it‘s carving out a bullish divergence as it‘s trading well above the Sep and Oct lows – unlike the TLT.
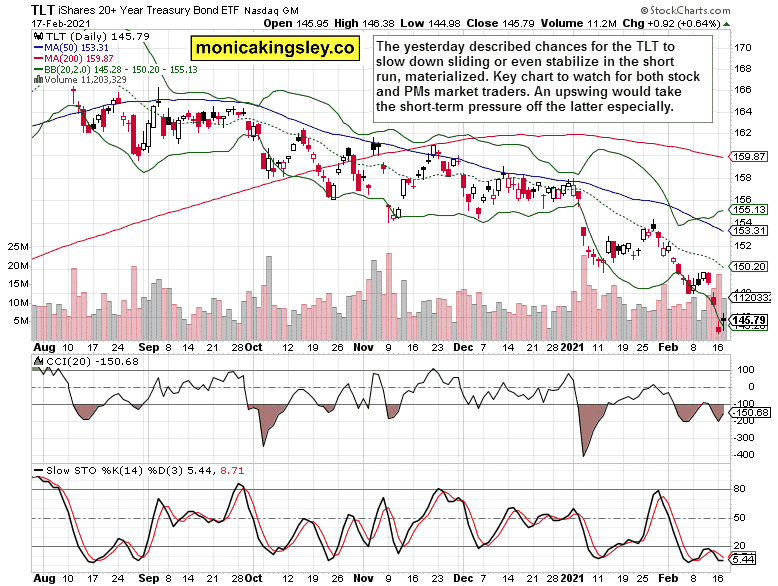
Speaking of which, such were my words yesterday, calling for a Treasury reprieve to happen soon:
(…) Long-term Treasuries (TLT ETF) are the key chart on my radar screen right now. The rise in yields is accelerating, and if progressing unmitigated, it would throw a spanner into many an asset‘s works. Even though it‘s not apparent right now, there is a chance that we‘ll see a slowdown, even a temporary stabilization, over the coming sessions. The larger trend in rates is higher, though, and in the dollar to the downside.

The dollar is still topping out, and a new daily upswing doesn‘t change that. I believe it will reverse and for the new downleg reassert itself.
Gold, Silver, and Commodities
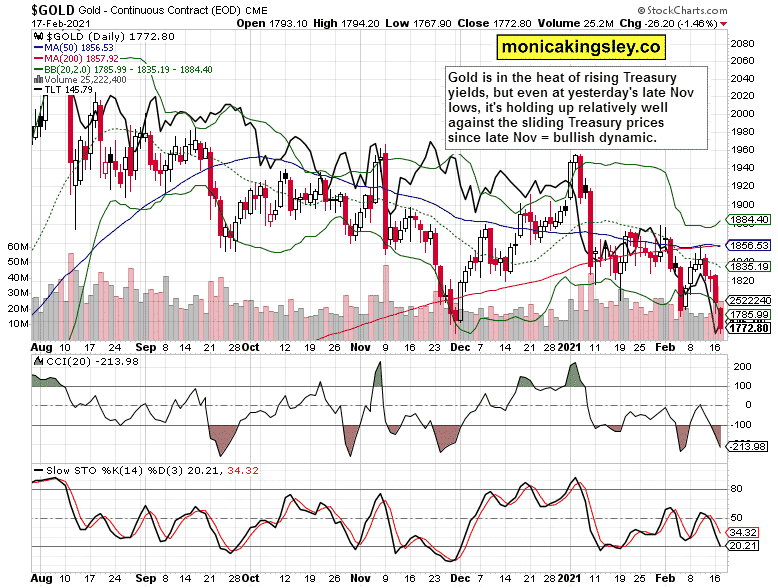
The encouraging, budding short-term resilience of gold to rising Treasury yields got a harsh reality check yesterday. While the latter ticked higher, gold declined regardless. Closing at the late Nov lows, it‘s still relatively higher given the steep rise in long-term Treasury yields since. A bullish divergence but a clearer sign of (directional) decoupling (negating this week‘s poor performance) is needed.
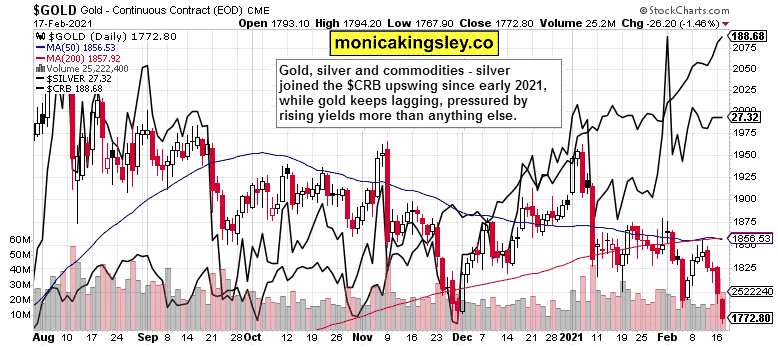
Let‘s look again at gold, silver, and commodities in the medium run. Silver decoupled from gold since the late Nov bottom in both, while commodities haven‘t really looked back since early Nov. Till the end of 2020, gold wasn‘t as markedly weak as it has become since, and actually tracked the silver recovery from the late Nov bottom. And the reason it stopped is the long-term Treasury yields, which quickened their rise in 2021. It looks like an orderly decline in TLT is what gold would appreciate – not a rush to the Treasury exit door.
Summary
The bearish push in stocks has a good chance of finally materializing today. How strong will its internals be? Will it entice the bulls to step in again? Signs are for this correction to run a bit longer in time. But the stock bull run is firmly on, and there are no signals thus far pointing to an onset of a deeper correction right away.
The gold bulls recovered a little of the lost ground, but that doesn‘t flip the short-term picture their way in the least. While the yellow metal is leading silver today, its overall performance in the short run remains disappointing. It seems the silver-gold spread trade I introduced you to a week ago is a much stronger proposition. Still, given the miners‘ signals, unprecedented monetary and fiscal stimulus, unfolding real economic recovery, inflation making its way through the system, and the dollar struggling to keep its head above water, the new PMs upleg is a question of time.
Thank you for reading today‘s free analysis, which is available in full here at my personal site. There, you can subscribe to the free Monica‘s Insider Club, which features real-time trade calls and intraday updates for both Stock Trading Signals and Gold Trading Signals.
Thank you,
Monica Kingsley
Stock Trading Signals
Gold Trading Signals
www.monicakingsley.co
[email protected]
* * * * *
All essays, research, and information represent analyses and opinions of Monica Kingsley that are based on availability and latest data. Despite careful research and best efforts, it may prove wrong and be subject to change with or without notice. Monica Kingsley does not guarantee the accuracy or thoroughness of the data or information reported. Her content serves educational purposes and should not be relied upon as advice or construed as providing recommendations of any kind. Futures, stocks, and options are financial instruments not suitable for every investor.
Please know that you invest at your own risk. Monica Kingsley is not a Registered Securities Advisor. By reading her writings, you agree that she will not be held responsible or liable for any decisions you make. Investing, trading, and speculating in financial markets may involve a high risk of loss. Monica Kingsley may have a short or long position in any securities, including those mentioned in her writings. She may make additional purchases and/or sales of those securities without notice.
-
Support
-
Platform
-
Spread
-
Trading Instrument


