

Volume Spread Analysis – Absorption Volume & Lower Trend Line
Chapter 11
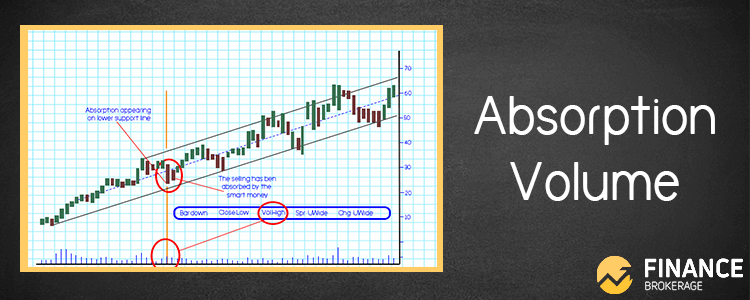
Upon witnessing the high volume on a down day, as it approaches the lower trend line, then it will serve as the selling pressure, however if the next day is above, it is ought to illustrate the high volume down-bar repressed buying (absorption of the selling) in order to lift the market the following day. Now, take note that this is a sign of strength.
Be that as it may, you are still required to have a phase of accumulation that should occur before the placement of a proper rally which takes time. The amount of accumulation or distribution that has taken place will strictly control the movement of the market.
A weak market has a widespread down-bar, on increased volume, as it comes near a lower trend line. Remember that the vital indicators are the words ‘approaches,’ and ‘increased’ volume.
Both the strength and weakness indicators will take place in different degrees of intensity. It could serve as obvious indications at first, however, as you go along and gain experience, you will realize that there are more obvious signs of strength and weakness.
Ways to Identify Absorption Volume
On a price chart, there are ways to identify absorption volume.
On a price chart, there are times when price breaks a resistance level on Ultra-High Volume and you can rapidly determine this as buying volume and you pass through on the breakout, however, the price turns around and goes to the opposite side. Meanwhile, there a few times that the price action will constantly remain to go upwards during a break of resistance.
“How do I know when a breakout is going to continue to break-out?” – A question that might pop up in your mind.
Well, Absorption Volume is the answer.
So, what are now the ways to identify it on a price chart?
Absorption volume can be noticed on resistance or support areas. According to Tom William’s “Master the Markets,” he pointed that the absorption volume as being a down bar with high volume and the next bar being up, where the selling has been absorbed by the Smart Money. In this situation, the absorption volume turns out to be a sign of strength. In most common cases, this occurrence can be seen around trend lines.
Moreover, absorption volume emerges at resistance levels. During the testing of a price action of a resistance level and we witness a widespread up bar on ultra-high volume and the next bar is an up bar which closes further above the previous bar’s close. The Smart Money considers this as buying.
Upon the occurrence of this maneuver, there’s a possibility that you would still want to witness a few testing back into the ultra-high volume bar. Testing happens solely to check if there are other supplies. Once you get a low volume test, this means that this is bullish and higher prices are expected.

