Trend-line Excel:Significance of Volume Near a Trend Line, Chapter 9
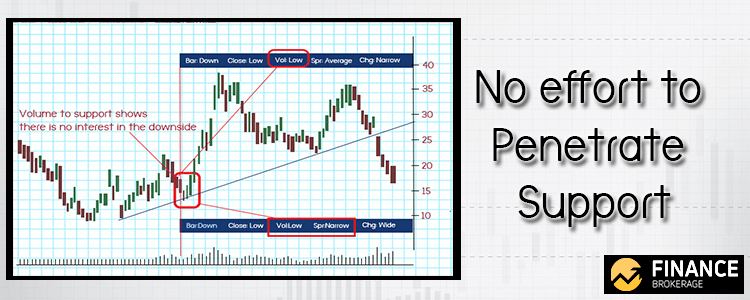
Essentially, the volume is one of the most significant characteristics in assessing the behavior of stocks around levels of support and resistance. Upon the arrival of a support line, the selling volume is ought to dry up as it advances toward the key level and buying volume should pick up as it departs. This confirms the validity of a support level and the uptrend will carry on. Remember to check the volume before giving any responses only if the price declines below the support level. Unless the volume is low, it isn’t as important as the presence of a heavy sell below the support level. Unless the volume picks up on the drop in the price below the trendline, then this signifies the end of the trend.
A trading range manifests the expected projected area of future trading. To change the trend, it will take you professional activity, money, and effort.
Commonly, the attempt of penetrating trend lines is visible through the movement of prices coming near the line, not actually on the line. Take note that you would typically observe that the attempt of penetrating a trend line through a form of wide spreads up with rising volume.

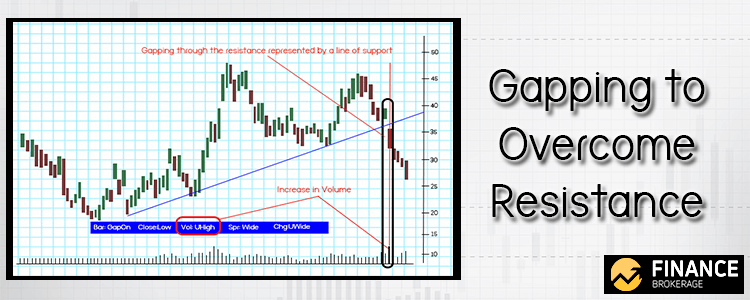
Also, remember to familiarize yourself with old trends and watch thoroughly when these lines were broken. Study the effort required. One way to overcome resistance is through gapping and the professional money can help you to locate the position of the resistance. Gapping in these areas could be done in numerous times because of the market-makers or specialists’ activity. This effort is mandated to be cost-effective always.
For instance, they are not possible to push up through resistance only if they are bullish. Every sudden activity will constantly have side benefits through panicking traders on the short side who then cover, locking traders in or out of the market, and encouraging traders not to sell.

Resistance is represented through various trend channels:
- The resistance line to higher prices is found on the upper line while the resistance to lower prices is represented by the bottom line.
Unless the volume is low on the upward movement of the market to the underside of the trend line, it is not going to go above very far. Nonetheless, upon the break of the trend line on the upside to become overbought, the current line is capable to become a potential resistance to lower prices. Remember that if the price stays longer above the line, the resistance to a down move becomes stronger.
You can expect high volume results upon the upward movement of a stock or Index in price as it reaches the upper trend line along with high volume’s presentation of a widespread up-day. This is because there’s an apparent reason to go above. That is, you would expect that there would be an upward movement in price through the upper trend line. However, if you can’t find results on the high volume by the next bar, then the opposite is likely to be true: the high volume is ought to have confined more selling than buying and will present that the trend is currently holding on.
How about when the high volume was buying, what would be the results of prices the following day?


