

Candlestick Chart Patterns: Chapter 4 Understanding Candlestick Pattern
We’re done discussing the four major candlestick patterns. Firstly, in chapter 1, the bullish reversal pattern. Secondly, in chapter 2, the bearish reversal pattern. Lastly, in chapter 3, the indecision and continuation patterns.
In this post, we’ll discuss how to understand any specific candlestick with just one glance. Furthermore, understanding what it represents within the market. Continue reading because the next stuff we’ll tell you is very critical in learning how to understand each specific candlesticks.
Take note of three things that we’re about to enumerate, then read further what each means. One, the candlestick body color will tell you who’s in control in the market. Two, the length of the candlestick wick indicates the price rejection. Three, the ratio of the candlestick body to its wick could tell you the whole story.
Let’s go through one by one.
The color of the body
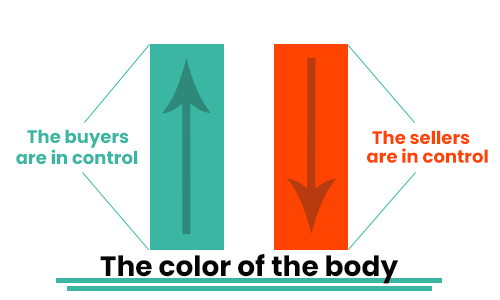 To clarify, we’ll put it in simple words. Whenever you see the candle closing over the open, it indicates that the buyers are in control of the market at the moment. That’s why the market closes higher at the time.
Now whenever you see a candle closing under the open, it indicates that the sellers are in control of the market at the moment. That’s why the market closes lower at the time.
Length of the wick
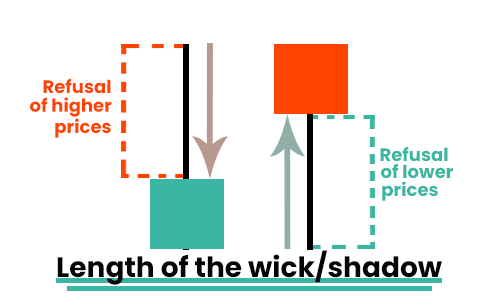 Meanwhile, whenever you get long upper shadow/wick, it indicates a strong refusal on higher prices. On the flipside, whenever you get a long lower shadow, it indicates strong refusal on lower prices.
However, there are instances that the shadow/wick is short. To simply put, it means there is a weak refusal on the prices.
The ratio of the body to the wick
Now, remember, don’t just focus on one thing while looking at a candlestick. Pay attention of a greater picture. Look at both the body and the wick then analyze the whole story.
Observe the samples below
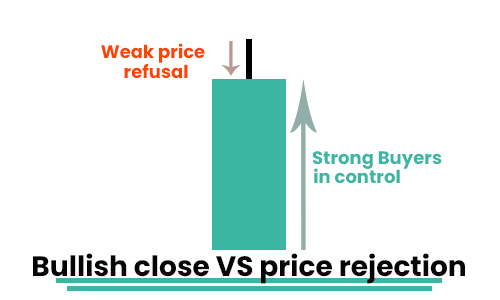 This sample candlestick indicates that the buyers are in control because of the minimal selling pressure.
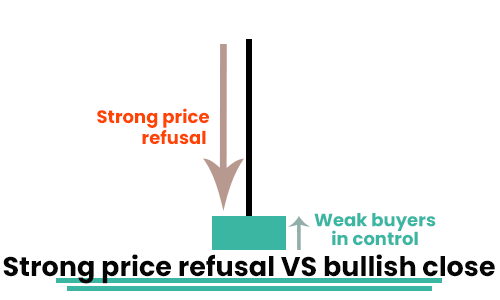 In this sample, it indicates that the sellers are in control because of the reversal on most of the earlier gains. That is to say, even with bullish close, the overall picture is bearish at the moment.

