

Candlestick Chart Patterns: Chapter 1 Intro & The Bullish Reversal Patterns
There are different ways to analyze a market chart. In the trading platform, you can decide either to use a candlestick pattern, bar, or a line. At some point, you’ll wonder which among them will you use. For most experienced traders, the most popular among them is the candlestick pattern.
This post will extensively discuss the use of the candlestick pattern. Take time to digest each pointer that will be present in this post.
The Candlestick pattern
The pattern itself originated in the Japanese rice trader named Munehisa Homma in the 1700s. About 300 years later, the pattern is presented to the western community by the man named Steve Nison. He writes a book titled, Japanese Candlestick Charting Techniques.
As of now, that’s likely the original ideas modified resulting in widespread use of candlestick patterns.
How to read a candlestick pattern?
There are four data points in each candlestick pattern. Firstly, the “open” indicating the opening price. Secondly, the “high” indicating the highest price on a fixed time period. Thirdly, the “low” indicating the lowest price on a fixed time period. Lastly, the “close” indicating the closing price. Look at the image below to learn further.
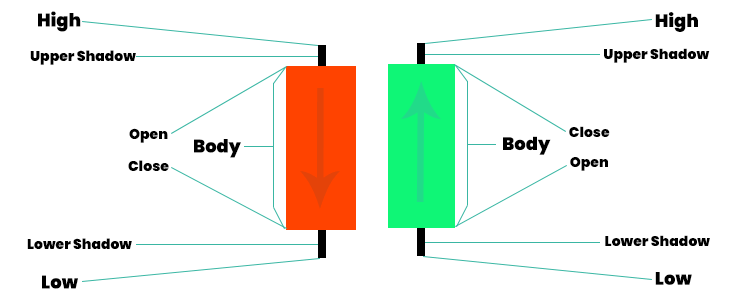 Additionally, for a bullish candle, the open price is always under the close. For the bearish candle, open price is always over the close.
Bullish Reversal Patterns
A bullish reversal candlestick indicates that the buyers are in the moment in control of the market. But that doesn’t mean for you to go long immediately whenever you spot bullish reversal. It will not offer you the edge within the market.
On the flip side, combine the pattern with other tools to look for the high probability trading setup. We’ll discuss those further. But for now, let us list down the five bullish reversal patterns you should know.
– The Hammer
 A one-candle bullish reversal pattern which forms upon a decline in price. One, it has a little no upper shadow. Two, the price nears at the top 1/4 of the range. Three, the shadow below is about two or three times the length of the body.
A bullish hammer candlestick indicates various scenario. One, whenever the market opens, sellers takes control and pushes the price lower. Two, in the selling climax, big purchase pressure steps in and pushes the price higher. Three, the buying pressure is too strong it close over the opening price.
Simply means, a hammer is a bullish reversal candlestick pattern showing rejection of the lower prices. The presence of the hammer candlestick doesn’t mean the trend is to reverse immediately. Look for further confirmation to increase the possibility that the trade is working out.
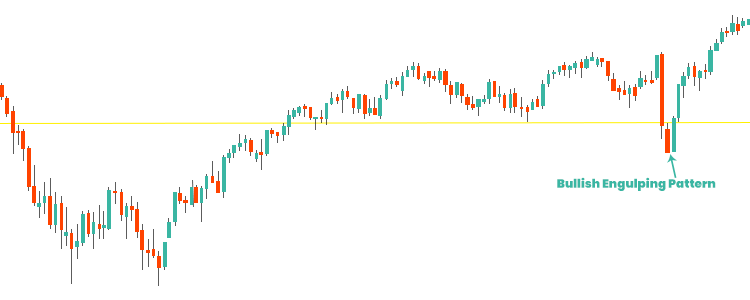
– The Engulfing Pattern
 A two candle bullish candlestick reversal pattern which forms upon a decline in price. There are different ways to recognize an engulfing pattern. One, its first candle has a bearish closing. Two, the body of the second candle covers the body of the first candle. Lastly, the second candle closes as bullish.
Bullish Engulfing pattern indicates two things. At one hand, the first candle, sellers take control of the market as they close lower for the period. On the other hand, the strong buying pressure moves in, closing over the previous candle high. And as of that moment, the buyers have won the market.
To sum up, the engulfing pattern shows that the buyers overwhelmed the sellers. The buyers are also in control of the market now. Usually, a hammer candlestick is a bullish engulfing pattern on the lower timeframe. Hammer candlestick might be a form of two candlesticks on a different time frame.
– The Piercing Pattern
 Another two candle reversal candlestick pattern forms upon price decline. However, dissimilar with the bullish engulfing which closes over the previous open, piercing pattern closes within the form of the first candle. When it comes to strength, piercing pattern is not as strong as the bullish engulfing.
There are ways to recognize a piercing pattern. One, the first candle has a bearish close. Two, the body of the following candle closes behind halfway of the first candle. Lastly, the second candle closes bullish.
A piercing pattern indicates two things. One, sellers are in control as they closed lower for the period. Two, purchasing pressure moves in and closing bullishly indicating that there are purchasing pressure nearby.
– The Tweezer Bottom
 Another two candle reversal pattern present upon price decline. There are two ways to recognize a Tweezer Bottom pattern. One, the first candle confers rejection of the lower prices. Two, the following candle re-tests the low on the previous candle and closing higher.
A tweezer bottom indicates two things. Firstly, on the first candle, sellers push the price lower meeting with some purchasing pressure. Secondly, sellers again try to push lower yet failing and finally overwhelms by strong purchasing pressure.
To sum up, the tweezer bottom indicates the market is in difficulty trading lower. With two attempts to push the price lower, still, it’s likely to head higher.
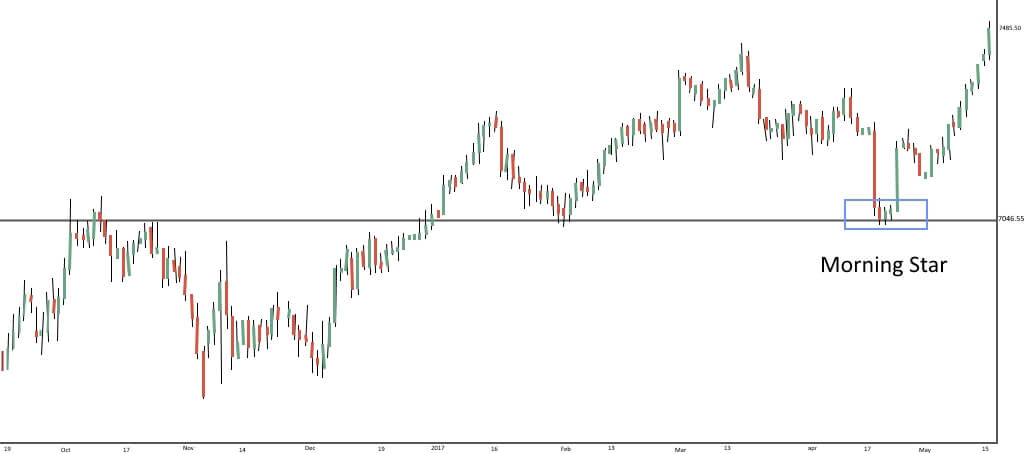
– The Morning Star Pattern
 A morning star pattern is a three candle bullish reversal pattern occurring upon price decline. There are three ways to indicate morning star pattern. One, the first candle has a bearish close. Two, the following candle has a small range. Three, the last/third candle closes forcefully higher.
Morning star pattern indicates three things. First, the initial candle indicates sellers are in control because the price closes lower in the market. Second, the following candle indicates indecision within the market because both sellers and buyers pressure is at equilibrium.
To sum up, the morning star indicates that the sellers are tired and the buyers are in control at the moment.
Bullish Reversal setups
To further learn on the bullish reversal patterns (Hammer, Engulfing, Piercing, Tweezer Bottom, and Morning Star) will look at them on a sample market chart.
Just to recall, don’t trade in candlestick pattern in isolation for it doesn’t offer an edge for you in the market. Now here’s how to do it. Firstly, if the market is trending higher, wait for a pullback going to the support level. Secondly, if the price pullbacks to the support, wait for a bullish reversal pattern. Lastly, if there are bullish reversal candlestick pattern, make sure the size of it is bigger than the earlier candles as an indication of a strong rejection. Observe the sample chart below to understand further.
Chapter 2 – The Bearish Reversal Pattern >>>

