


Advanced Trading Guide: Doji Candlestick Analysis
Have you ever been into technical analysis or interested in learning about a particular candlestick chart? Have you been thinking about price charts, price action signals, day trading, price reversals, and much more, but specifically about the Doji candlestick analysis pattern?
The Doji Candlestick Analysis pattern is among the misunderstood candlestick patterns. There are four types of Doji candlesticks. Each has a different meaning, and most advanced traders can figure them out.
Most books written will teach it as a representation of indecision in the markets. Looking at the length of this candlestick pattern, you can speculate on the future market movement. In this post, you’ll learn how to read and analyze Doji candlestick patterns.
What is Doji?
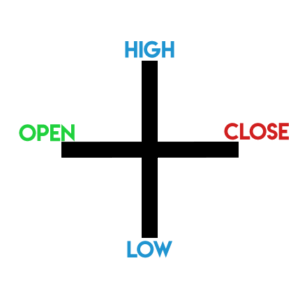
Doji candlestick appears on the trading chart when the market opens and closes at the same price level. It simply means that the market is uncertain if the buyer or sellers are in control.
But there is a variety of it with various meanings for each. For now, let us know what the usual chart looks like:
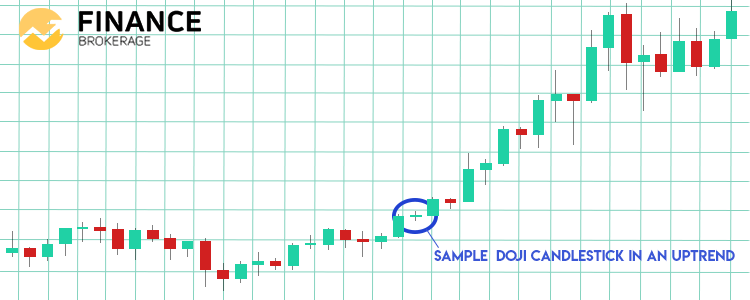
We are talking about a simple candlestick pattern. But it differs when taken into context. It provides traders with a sense of how the market will move. For instance, when spotting a chart in an uptrend.
This simply means that the market is in equilibrium (temporarily). The market will move higher on the path with the least resistance after enough rest. Observe the sample graphic below:
Avoid This Usual Mistake:
The majority of traders spot Doji Candlestick Analysis in an uptrend and decide to go reverse. That’s a really bad idea. Looking at the market, if a trend is going upward and is moving higher, why would it lose against a single pattern like this one?
Different Types of Doji Candlesticks
Dragonfly Doji
In fact Dragonfly one rarely occurs in which the price closes on the exact position it opened. Preferably, there is variation in having a small body with a long wick in the bottom. The meaning will be the same. The important point is being familiar with what it means.
Dragonfly Doji usually appears if the opening and closing prices are at the same level with a long lower wick. Below is a sample of a bullish one:
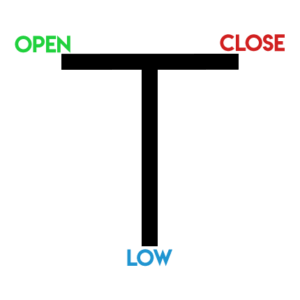
That shows that the sellers are going in and pushing the price lower whenever the market opens. But it won’t take a long time before buyers take control of the market, pushing the price higher.
How to Trade with Dragonfly Doji?
Support marks an area where possible buying may come in. Go long whenever the price comes to the support area and creates a Dragonfly Doji. The exact scenario tells you that it rejected lower prices with a high possibility to reverse higher. Observe the sample chart below:

When it comes to trending markets, the market would likely bounce off the moving average. But you may go long whenever the price pulls back toward a moving average forming a Dragonfly Doji. Observe the sample chart below.

Gravestone Doji
Gravestone Doji appears whenever the open and close are in the same amount but with a long upper wick. Below is an example of a Gravestone Doji:
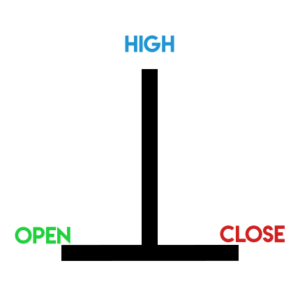
This type shows that buyers come and push the price higher when the market opens. But it won’t take long until sellers gain control and push the price lower. The market finally closes with the same price it opened. This is a sign of weakness because sellers are in control.
How to Trade with Gravestone Doji?
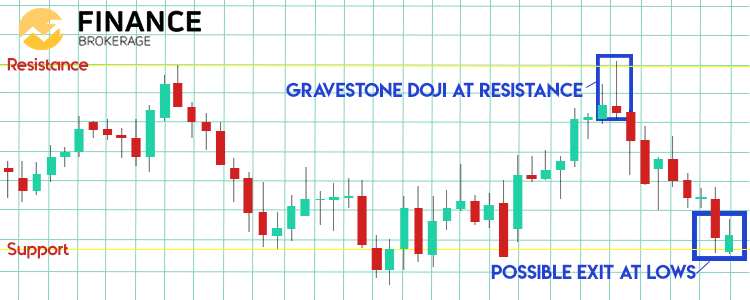
The resistance area marks the part where possible selling pressure could come. Go short when the price gets close to resistance forming a Gravestone pattern. The scenario simply shows that the market rejected higher prices and could reverse lower. Observe the sample chart below.
Regarding a trending market, Gravestone Doji could make the market bounce off its moving average. Go short whenever the price pulls back towards the moving average, forming a Gravestone Doji. Observe the sample chart below.

Long Legged Doji
Long Legged Doji appears whenever the open and close are at the same price but with a long upper wick and lower wick. Below is an example of a Long Legged Doji.

This pattern shows that the market is uncertain upon a huge expansion in volatility. This pattern rarely occurs, but if it appears, expect volatility to die out for some time before it picks up again.
Here are the two ways to trade with Long Legged Doji
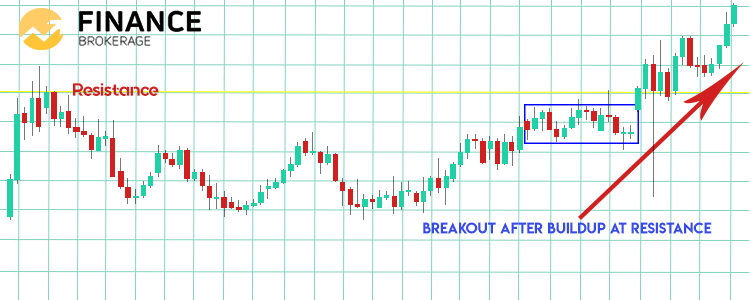
- After a huge expansion in volatility, the market will need to take a break before it continues. For a while, the market will be in the range to gain orders before breaking out. That means you can go long on the lows of the Long-Legged Doji. Observe the sample chart below.


- Based on the first sample above, it will likely break out whenever the price tests the high/lows a lot of times. Look at the sample chart below.

What Does Doji Candlestick Pattern Tell Us About?
Once a trader observes a particular Doji candlestick, it can clearly be seen as a single phenomenon in isolation from other indicators. It could be a sign of market indecision. It shows that bulls and bears don’t have control of the market.
Nonetheless, when this type of candle is analyzed with the previous candlestick pattern, it could imply a price reversal. On the other hand, it can also show a continuation of an asset’s price movement. For that particular reason, it’s crucial that, besides finding a great trading strategy, we should also consider the Doji candle in connection with other patterns and indicators.
The candle includes little information itself when it comes to future price movements.

