Oil natural gas: The price of oil in a new retreat
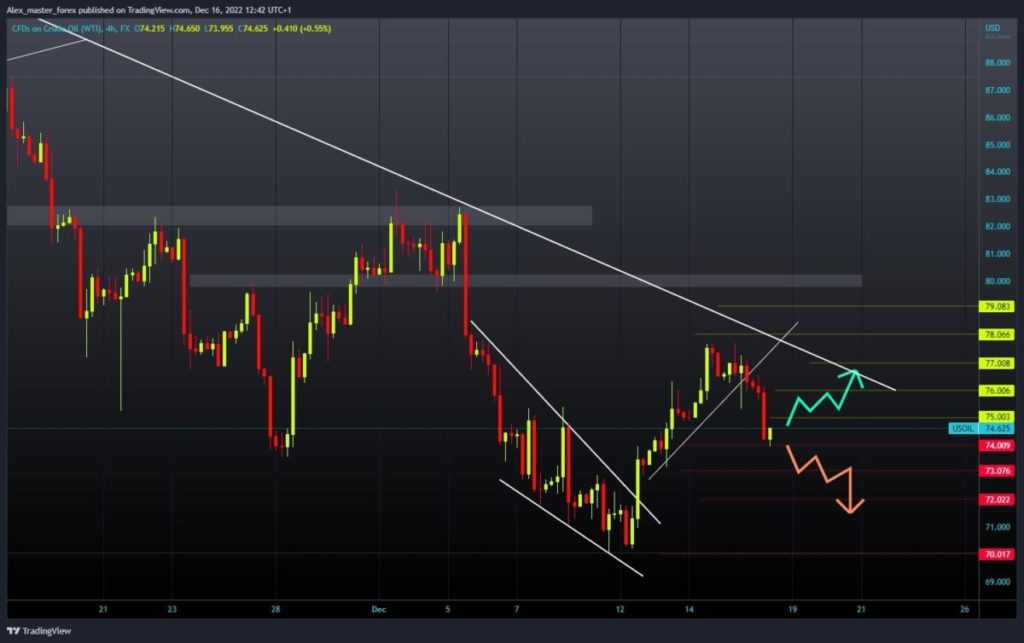
- During the Asian trading session, the price of oil fell from $76.00 to $74.00.
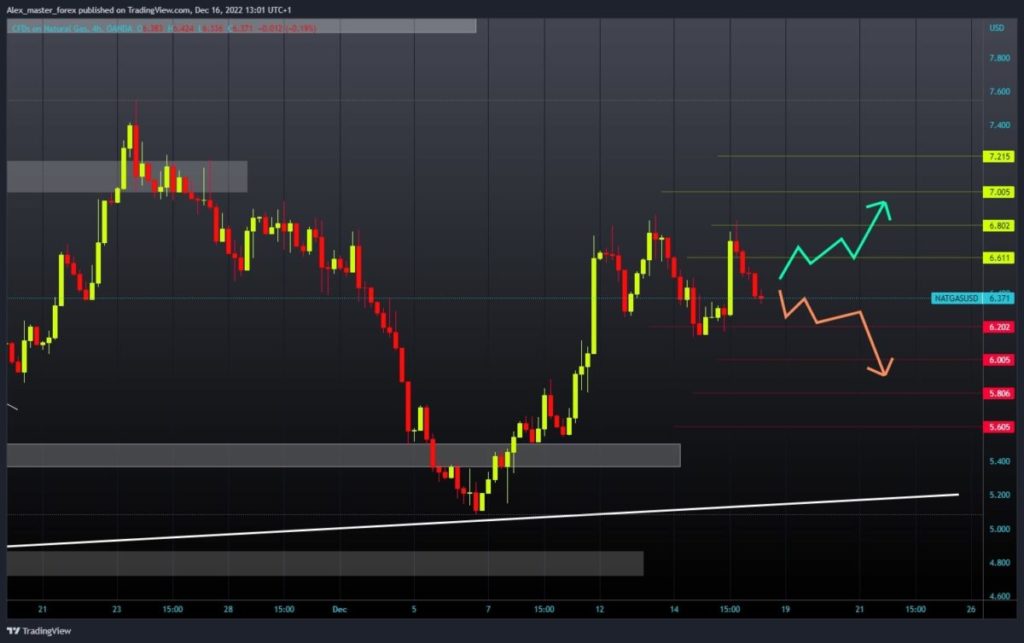
- The price of gas reached the $6.80 level again yesterday.
Oil chart analysis
During the Asian trading session, the price of oil fell from $76.00 to $74.00. We currently manage to find support and move up to the $74.45 level. Oil price growth stalled on Wednesday after The Energy Information Administration released a large inventory increase of more than 10 million barrels. We have been in a bearish trend ever since.
To continue the bearish option, we need a negative consolidation and a new break below the $74.00 level. Potential lower targets are the $73.00 and $72.00 levels. For a bullish option, we need a positive consolidation and a break above the $75.00 level. Then we need to stay up and, with a new bullish impulse, start the continuation of the price recovery. Potential higher targets are the $76.00 and $77.00 levels.

Natural gas chart analysis
The price of gas reached the $6.80 level again yesterday. And again, we saw a new pullback that brought us back to the $6.40 level. Gas price is not ready to break that barrier yet, and now we are waiting for a new momentum that would try it in the next attempt. We need to break above the $6.80 level for a bullish option and try to hold above.
Potential higher targets are the $7.00 and $7.20 levels. We need a negative consolidation and a return to the $6.20 support level for a bearish option. A price break below would drop us to a test of support at the $6.00 level. If we don’t get that desired support, the gas price will go down to $5.80 or $5.60.


