


Oil and Natural Gas: Under pressure
- During the Asian trade, the price of crude oil was volatile.
- The price of natural gas has been moving for the fourth day without major changes in the range of $ 6.60
- The U.S. Petroleum Institute (API) reported an increase in the crude oil of 5.607 million barrels this week, while analysts predicted a withdrawal of 1.433 million barrels.
Oil analysis chart
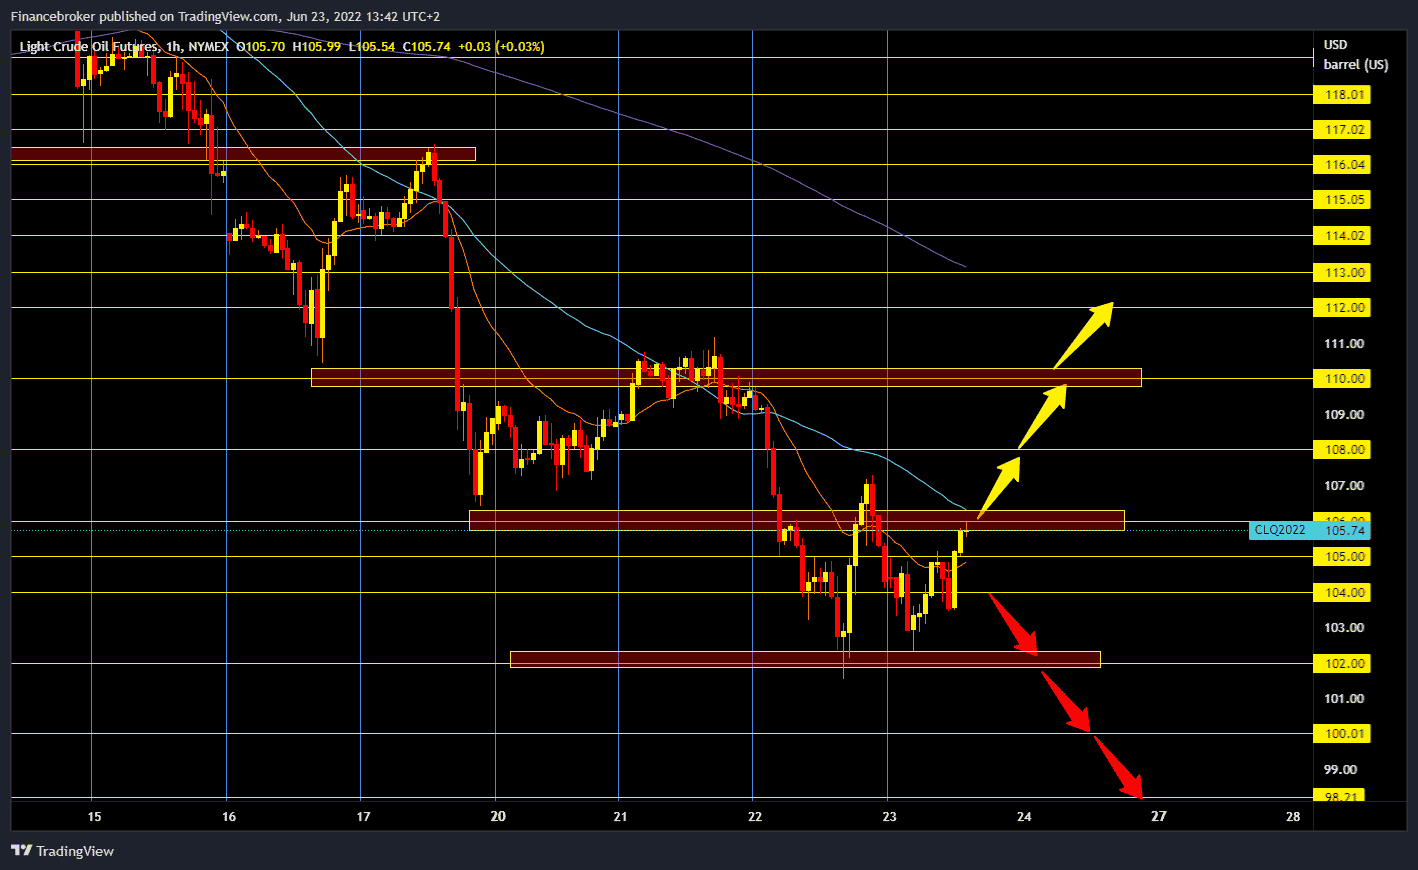
During Asian trade, the price of crude oil was volatile. Fear of the recession and the lower demand for oil that goes with it still keep the price of oil under pressure. The American Petroleum Institute announced last night that crude oil stocks in the USA increased by 5.6 million barrels last week. Crude oil is trading at $ 105.77 a barrel, down 0.44% from last night. At 4:30 p.m., an official government report will be released on the state of crude oil and petroleum products in the United States.
This morning’s minimum is $ 102.30, the price quickly found support there, and now we see a recovery to $ 105.70. We need continued positive consolidation and price growth above the $ 106.00 level for the bullish option. Price then received additional support in the MA50 and MA20 moving averages. After that, the price of oil could recover to $ 108.00. We need negative consolidation and withdrawal to this morning’s minimum for the bearish option. The break below leads us lower to $ 102.00, and if it doesn’t hold up, we descend even lower to the $ 100.00 level.
Natural gas chart analysis
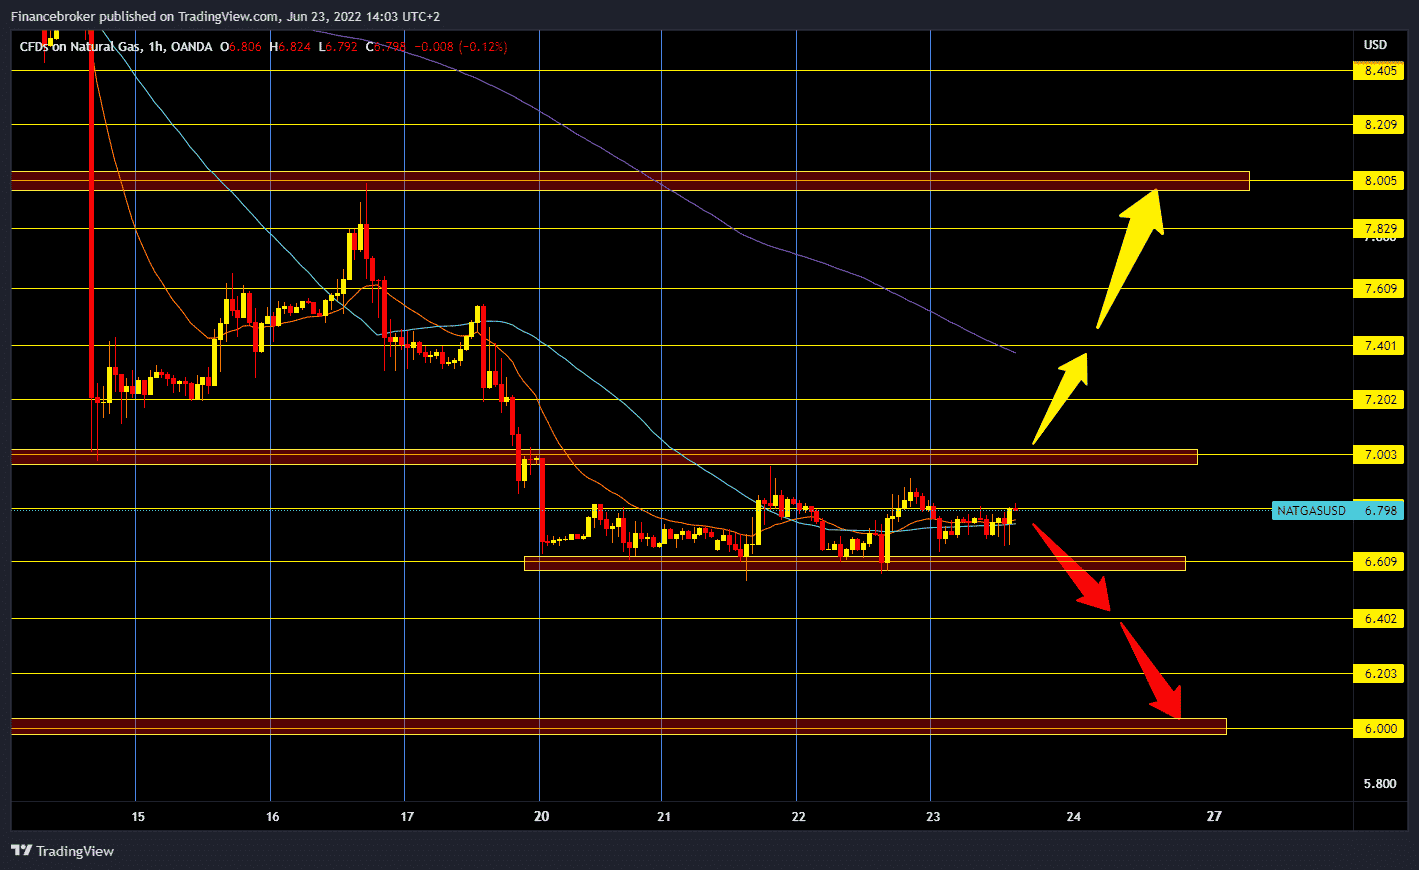
The price of natural gas has been moving for the fourth day without major changes in the range of $ 6.60-7.00. As the European session progresses, the gas price is slowly leaning to the bullish side, and we are now at the $ 6.80 level. For the bullish option, we need the continuation of this positive consolidation to the $ 7.00 resistance zone. A price break above this resistance would open us up to $ 7.20 and $ 7.40. At the $ 7.40 level, we come across the MA200 moving average, which can be an obstacle for us to continue on the bullish side. We need negative consolidation and a return to the lower support zone at the $ 6.60 level for the bearish option. A price break below would direct us to a $ 6.00 large support zone.
Market overview
API Reports
The U.S. Petroleum Institute (API) reported an increase in the crude oil of 5.607 million barrels this week, while analysts predicted a withdrawal of 1.433 million barrels. API data indicates it is the first production of over 5 million barrels since mid-February. The upgrade came when the Ministry of Energy released 6.8 million barrels from strategic oil reserves in the week ending June 17. According to API data, U.S. crude oil inventories have fallen by about 68 million barrels since early 2021 and about 11 million barrels since early 2020. This week, the API reported an increase in gasoline stocks of 1.216 million barrels for the week ending June 17, compared to last week’s withdrawal of 2.159 million barrels.

