


Oil and Natural Gas: Very Volatile Period
- The price of oil managed to climb up to $91.00 yesterday.
- The price of natural gas was very volatile yesterday. The day started at $9.20, then the price jumped to $9.70.
- The United States added just 18 billion cubic feet to its natural gas supplies for the previous week.
Oil chart analysis
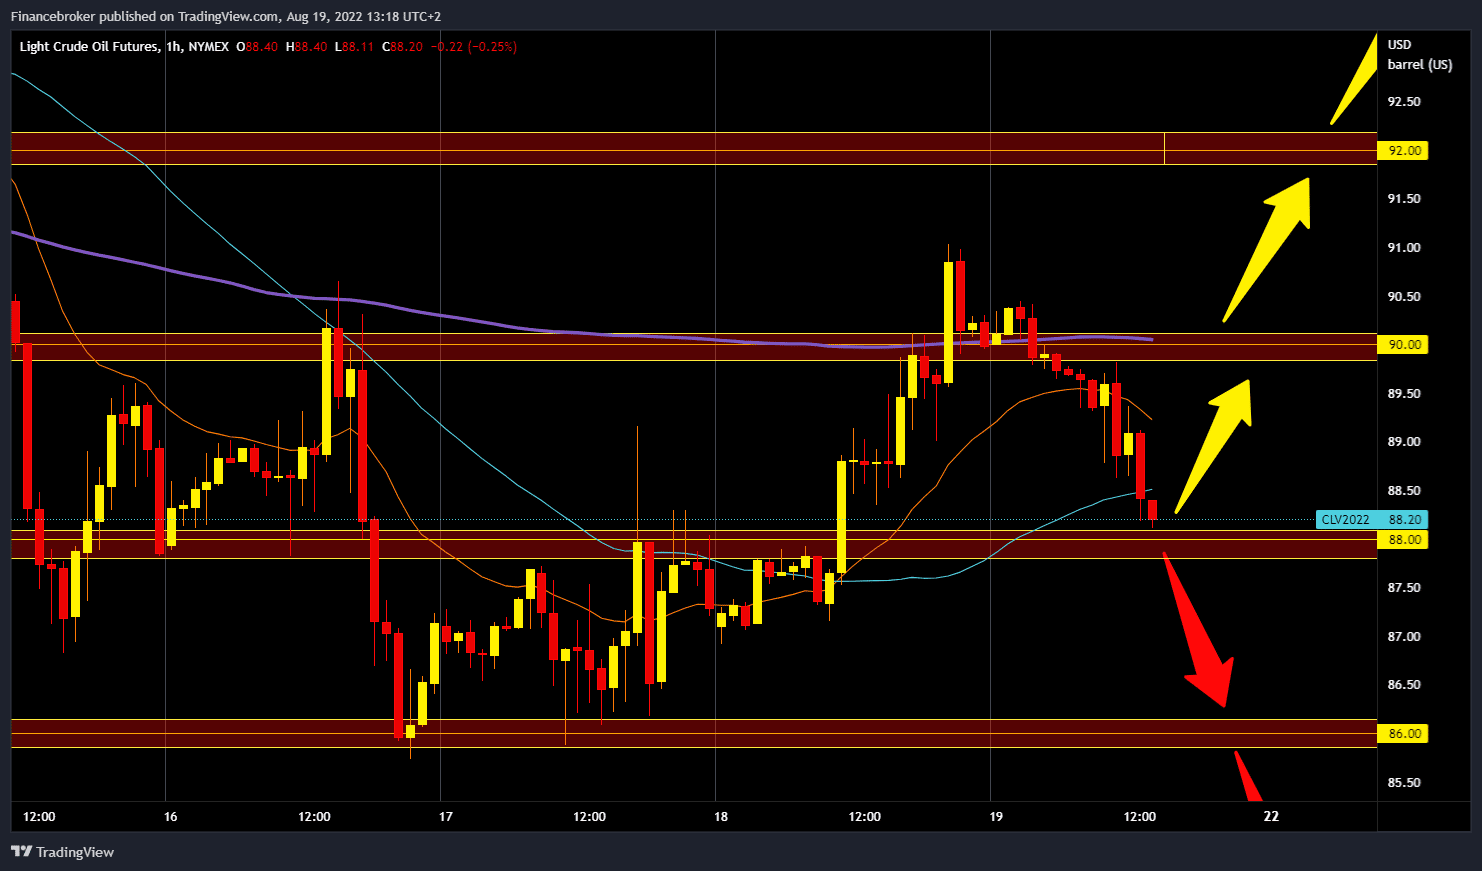
The price of oil managed to climb up to $91.00 yesterday. She did not stay there for long, and we saw a pullback to the $90.00 level. During the Asian trading session, the price of oil tried to resist the bearish pressure and stay at that level, but without success. A continuation of the pullback followed, and oil prices broke below this morning’s support. The decline continued during the day, and we are now at $88.30. We are likely to retest support at the $88.00 level soon. To continue the bearish trend, we need a break below that level. Then we would probably continue to the next support zone. Potential lower targets are the $87.00 and $86.00 levels. For a bullish option, we need a new positive consolidation and a return to the 90,004 level. After that, we need a break above and try to maintain above, and potential higher targets are $91.00 and $92.00 levels.
Natural gas chart analysis
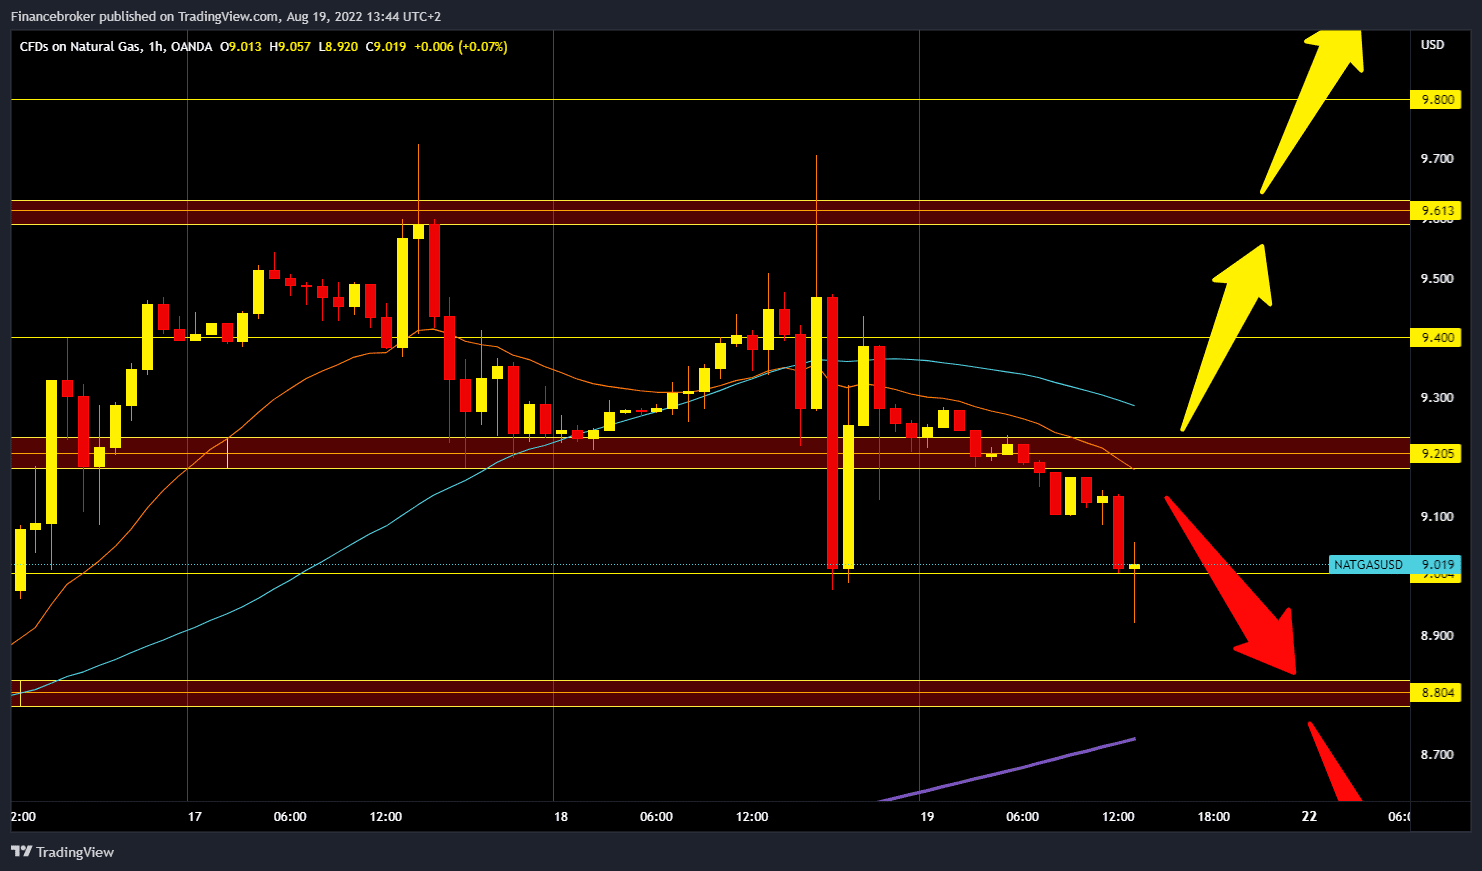
The price of natural gas was very volatile yesterday. The day started at $9.20, then the price jumped to $9.70 and very quickly fell to $9.00. So, we saw another price jump to $9.40, and at the end of the day, we were back to the starting position at $9.20. During today’s Asian session, the gas price again fell below $9.20 and moved to the bearish side. Today’s low was $8.92, while we are now moving at the $9.00 level. For a bearish option, we need a continuation of the negative consolidation and another move below $9.00. A potential lower target is the $8.80 level, and additional support at that point is in the MA200 moving average. We have to climb above the $9.20 level for a bullish option. Then to stay in that place to consolidate for the next bullish impulse. In that zone, we come across the MA20 and MA50 moving averages, which can be additional resistance. Potential higher targets are $9.40 and $9.60 levels.
Market overview
The United States added just 18 billion cubic feet to its natural gas supplies for the previous week, the Energy Information Administration (EIA) reported in a weekly report. And Bloomberg reported that US inventories are still more than 10% below normal levels for this time of year.
Haitham al-Ghais, the new Secretary General of OPEC, told Reuters yesterday that he is slightly optimistic about the outlook for the oil market in 2023, adding that the world is handling the inflationary pressure on the economy very well.

