


Oil and Natural Gas: Three-day bullish trend
- During the Asian trading session, the price of crude oil is consolidating.
- The price of natural gas continues its three-day bullish trend.
- The U.S. Petroleum Institute (API) reported a large withdrawal for crude oil of 3.799 million barrels this week.
Oil chart analysis
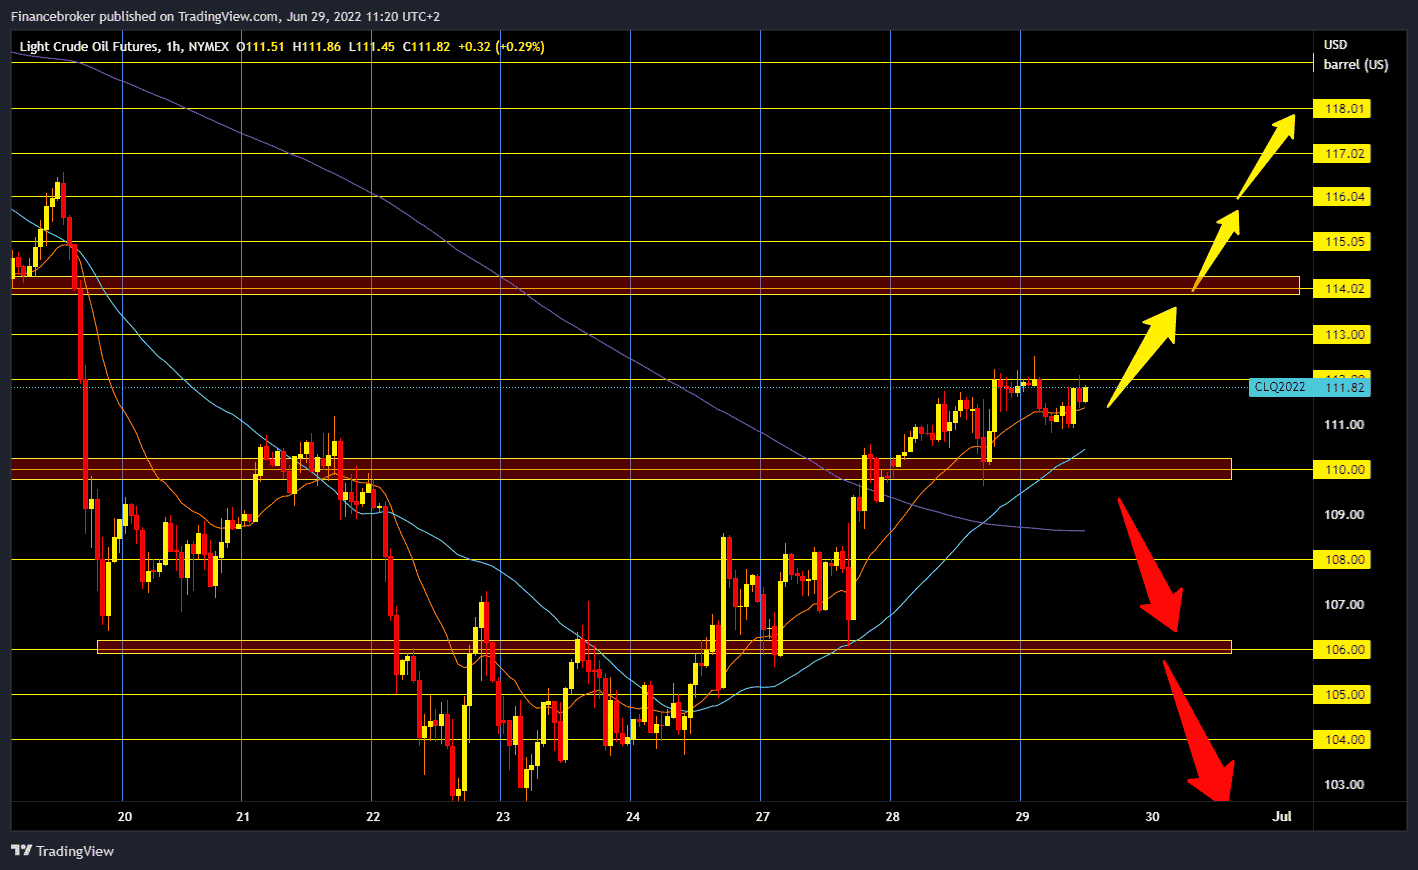
During the Asian trading session, the price of crude oil is consolidating. The American Petroleum Institute (API) announced last night that crude oil stocks in the USA dropped by 3.8 million barrels. An OPEC member, Libya, said that it was likely to halt exports to the Gulf of Syria region due to unrest that limited production. He added Ecuador to supply problems, where oil production could be completely suspended within 48 hours due to anti-government protests. Demand is higher than supply in the intense summer passenger and tourist season of driving and flying.
The leaders of the G7 group are still considering how to stop the growth of high energy prices, and one of the options is to establish a price limit for oil from Russia, for which there is no understanding by serious analysts in order to do effectively. Crude oil is trading at $ 111.61 a barrel, down 0.13% from trading tonight. We need to break prices above the $ 112.00 level for the bullish option. After that, we could proceed to the next resistance zone at the $ 114.00 level. We need a negative consolidation and test the $ 110.00 level for the bearish option. A break below would direct the price to the bearish side. Potential lower targets are $ 108.00 and $ 106.00 levels. Later in the U.S. session, an official government will publish a report on the state of crude oil and oil derivatives stocks in the United States.
Natural gas chart analysis
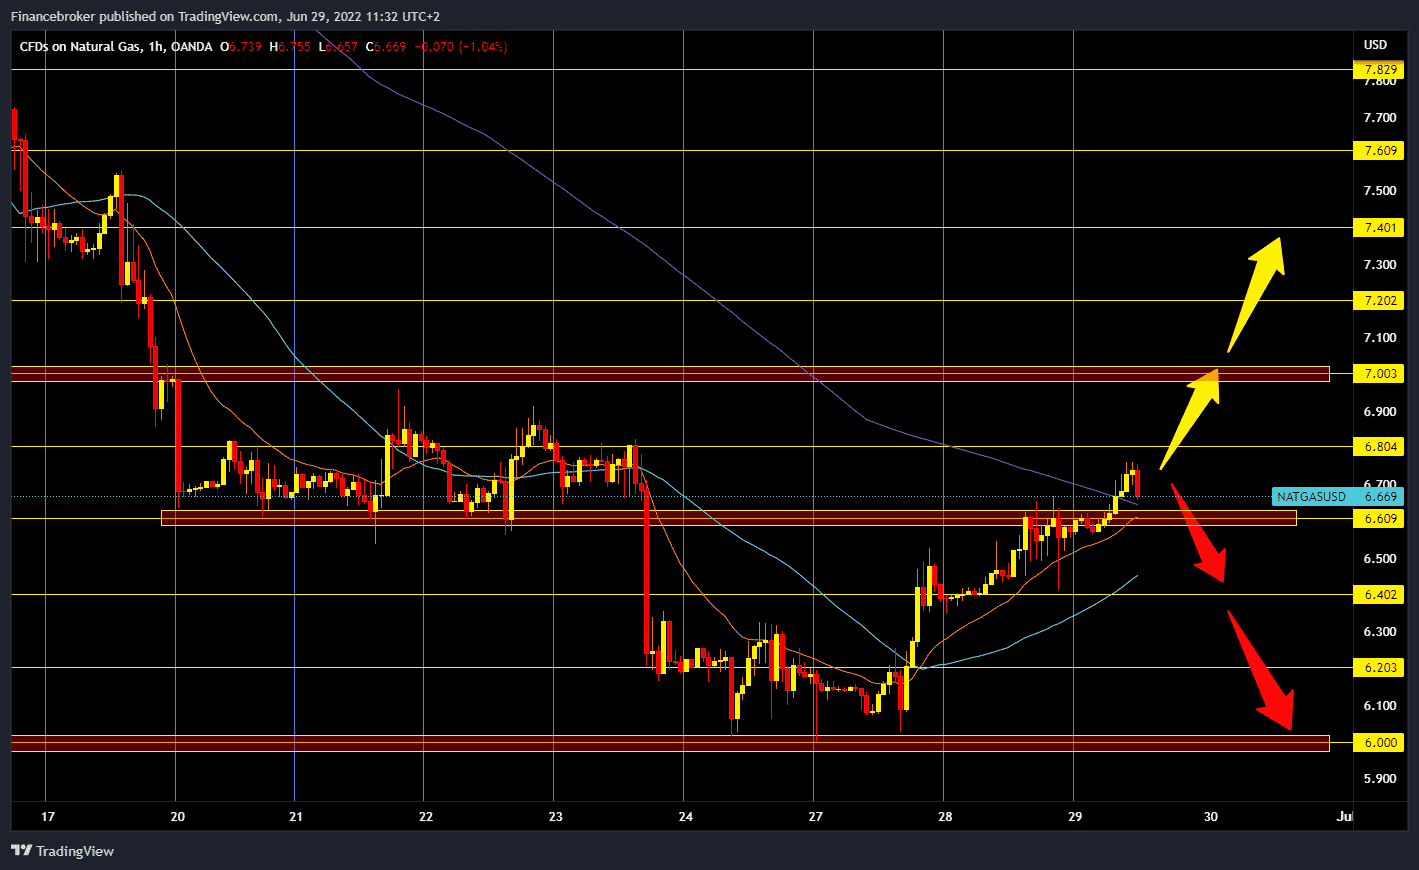
The price of natural gas continues its three-day bullish trend. After the gas price dropped to $ 6.00 on Monday, today, the price is already at $ 6.70. We managed to get back above $ 6.60, our previous support on the chart. We now need to stay above the $ 6.60 level to launch a new bullish boost to the $ 7.00 level. For the bearish option, we need a negative consolidation and a pullback below $ 6.60. After that, the bearish pressure could increase, which would direct the price towards lower levels of support. Potential lower support targets are $ 6.40, $ 6.20, and $ 6.00.
Market overview
API Reports Large Crude Draw
The U.S. Petroleum Institute (API) reported a large withdrawal for crude oil of 3.799 million barrels this week, while analysts forecast a withdrawal of 110,000 barrels. The construction came when the Ministry of Energy released 6.9 million barrels from strategic oil reserves in the week ending June 24.
According to API data, U.S. crude oil inventories have fallen by about 71 million barrels since the beginning of 2021 and about 15 million barrels since the beginning of 2020. Data on crude oil production in the United States for the week ending June 17 was unavailable on Tuesday after the EIA reported that a voltage surge on June 17 prevented it from publishing new data.
This week, the API reported an increase in gasoline inventories of 2.852 million barrels for the week ending June 24, compared to a rise of 1.216 million barrels the previous week.

