Oil and Natural Gas: The Price of Oil Continued to Retreat
- During the Asian trading session, the price of oil continued to retreat from yesterday’s high to the $89.80 level.
- This week’s gas price obstacle is the $5.60 level.
Oil chart analysis
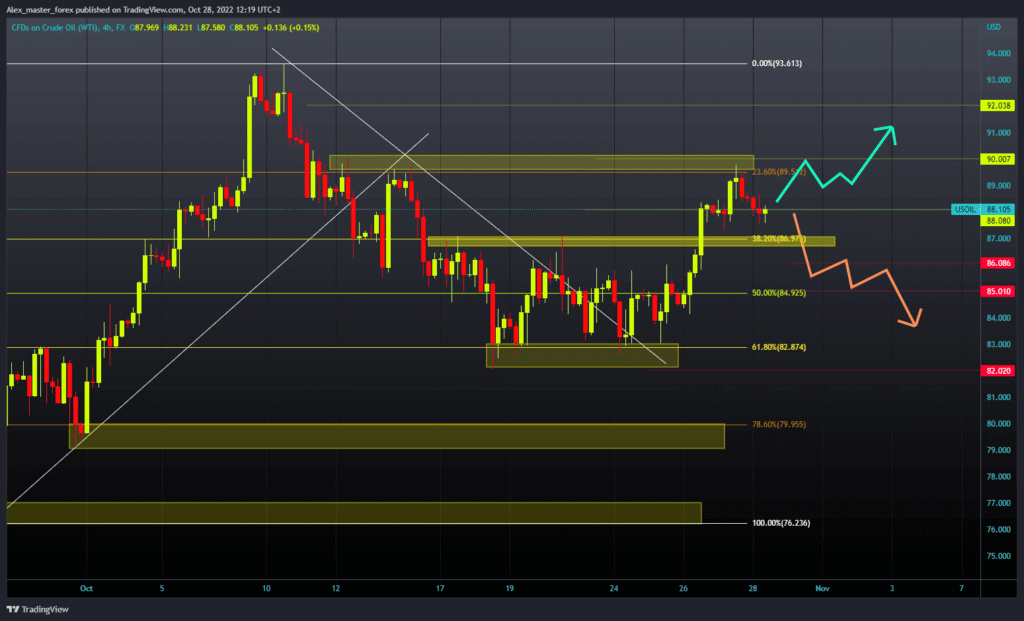
During the Asian trading session, the price of oil continued to retreat from yesterday’s high to the $89.80 level. This morning’s low was at the $87.50 level, representing a 0.75% drop since the start of trading last night. The price is currently finding support at that level, and we see a recovery above the 88.00 level.
For a bullish option, we need a continuation of the positive consolidation and a return to the upper resistance at the $90.00 level. Then we need to see a breakout above and try to stay up there. With a new bullish impulse, we could expect a further recovery of oil prices. Potential higher targets are the $91.00 and $92.00 levels.
We need a negative consolidation and continued pullback below the $87.50 level for a bearish option. An important support zone is at $87.00; if we see a drop below that, we could expect a continuation of the price pullback. Potential lower targets are the $86.00 and $85.00 levels.

Natural gas chart analysis
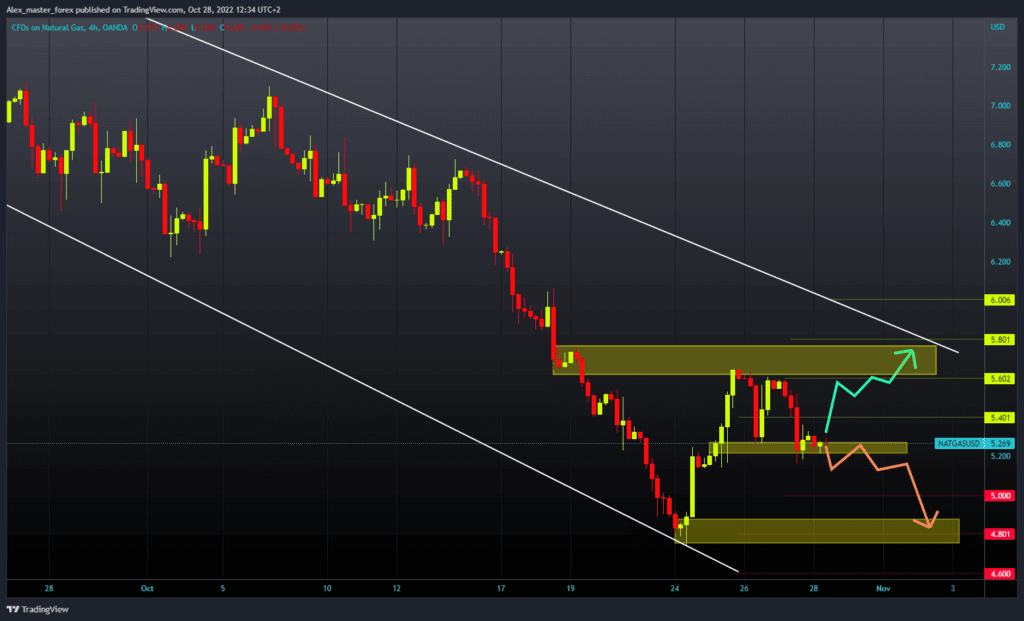
This week’s gas price obstacle is the $5.60 level. Yesterday, the price of gas stopped at that point for the second time and started another pullback. The drop in gas prices stopped at the $5.20 level.
During the Asian trading session, the price manages to maintain that level. For a bullish option, we need a new positive consolidation and a return of the gas price to the previous resistance zone around $5.60. We need to hang in there and try to rise above. After that, we could expect a further recovery of gas prices. Potential higher targets are the $5.80 and $6.00 levels.
For a bearish option, we need a negative consolidation and a drop below the current support level. Increased bearish pressure would influence the price to continue falling. Potential lower targets are the $5.00 and $4.80 levels.


