Oil and Natural Gas: The Drop in Oil Prices at $82.00
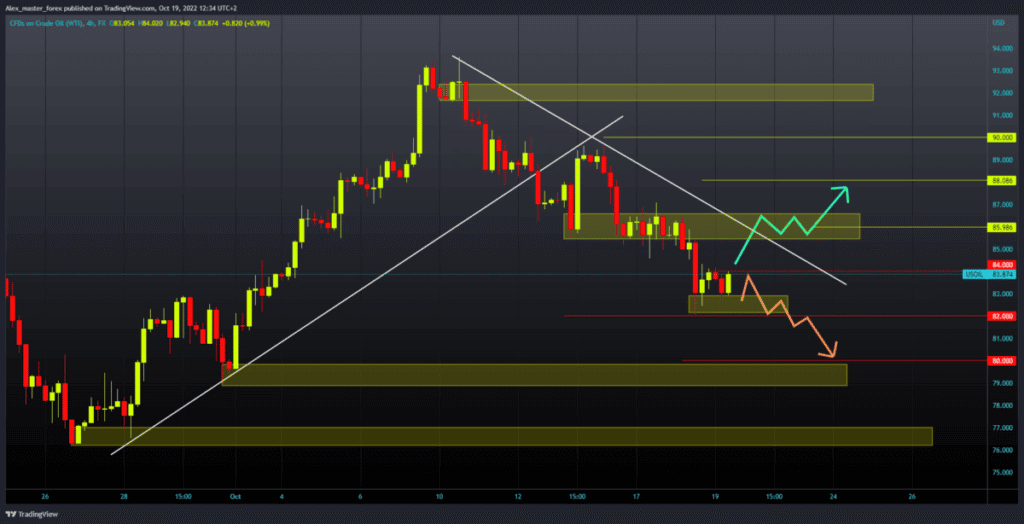
- Yesterday’s the drop in oil prices stopped at $82.00.
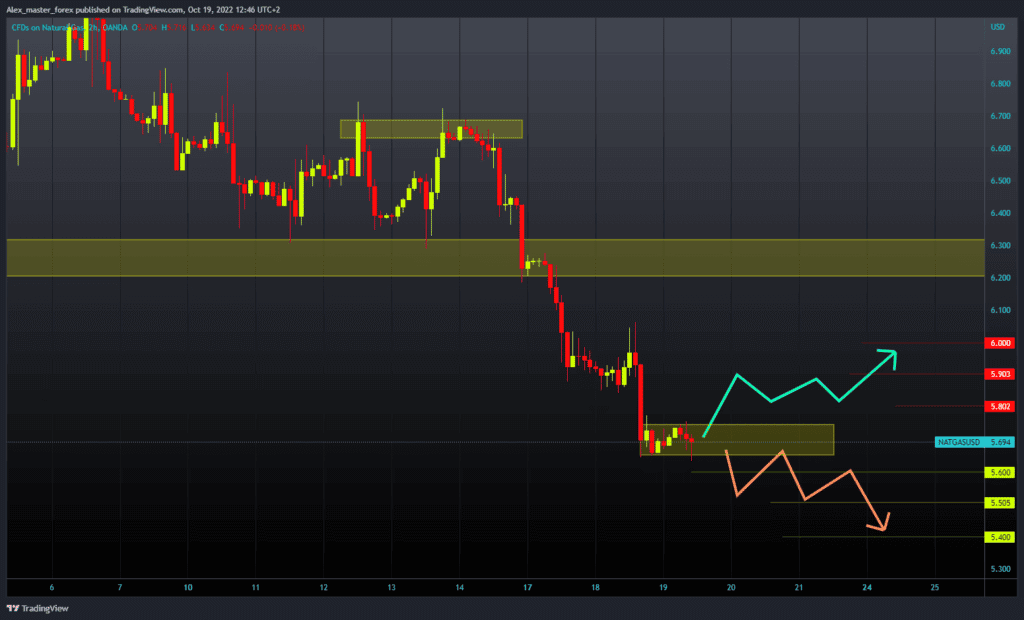
- The price of natural gas fell to its four-month low at $5.64 this morning.
Oil chart analysis
Yesterday’s drop in oil prices stopped at $82.00. After that, the price pulled back above the $83.00 level and has been moving in the $83.00-$84.00 range since then. During the Asian trading session, there were no significant impulses to indicate the next potential trend. For a bullish option, we need a positive consolidation and a move above $84.00.
Then we need to hold above there and try to continue the bullish option. Potential higher targets are the $85.00 and $86.00 resistance zones. For a bearish option, we need a negative consolidation and a drop in oil price to $82.00, yesterday’s low. A break below would signify that we can expect a continuation of the bearish trend. Potential lower targets are the $81.00 and $80.00 levels.

Natural gas chart analysis
The price of natural gas fell to its four-month low at $5.64 this morning. For now, the gas price is calm and manages to hold in that zone, but bearish pressure is evident, and a breakout below could easily occur. For a bullish option, we need a new positive consolidation and a rise to start with the $5.80 level.
After that, we could expect the price to move up to $6.00 and try to stay there. If they succeed in this, we could expect a further recovery in the price of natural gas. We need a continuation of the negative consolidation and a drop below the $5.60 support level for a bearish option. With that, we would form a new October low, and the potential lower targets are $5.50 and $5.40.:


