Oil and Natural gas: Oil’s gains stalled at $69.50
- During the Asian trading session, the price of oil retreated from $69.50 to the $69.00 level.
- During the Asian trading session, the gas price retreated from the $2.32 level.
Oil chart analysis
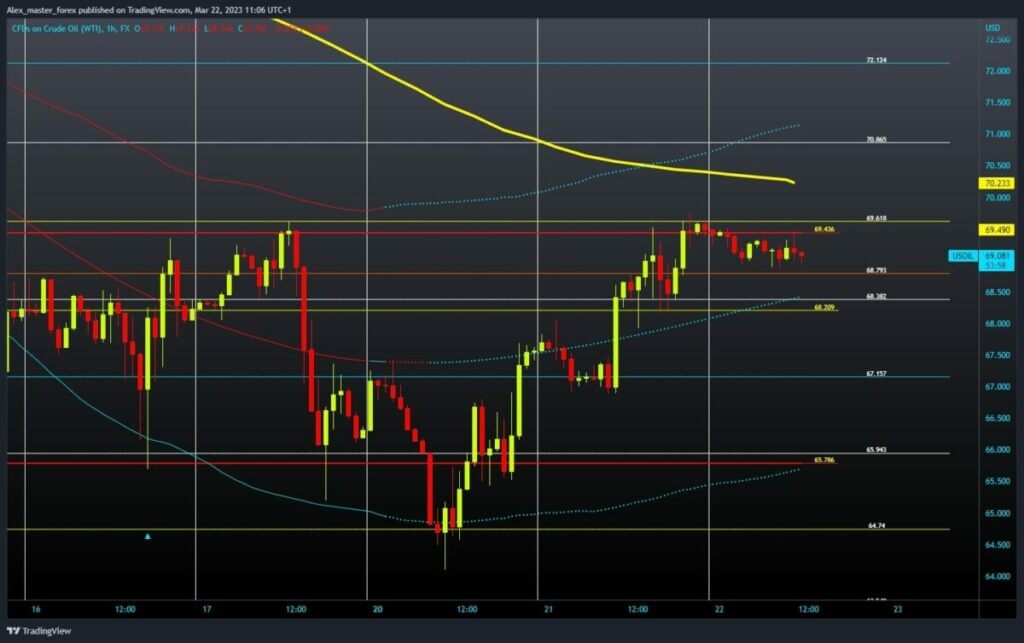
During the Asian trading session, the price of oil retreated from $69.50 to the $69.00 level. For now, the oil price has resistance at $69.50, and it is more likely that we will see a pullback if we do not move above the $69.50 level soon. We have additional resistance at the $69.62 level. for a bearish option, and we need a negative consolidation and a price drop below the $68.80 level.
After that, the price would likely continue to the next lower support zone of $68.20-$68.38. And a breakthrough below this zone would mean a bigger oil price retreat. We need a jump above the $69.62 level for a bullish option. Then we need to hold up there to try to get to the $70.00 level. Additional resistance above $70.00 is the EMA 50 moving average at $70.20.

Natural gas chart analysis
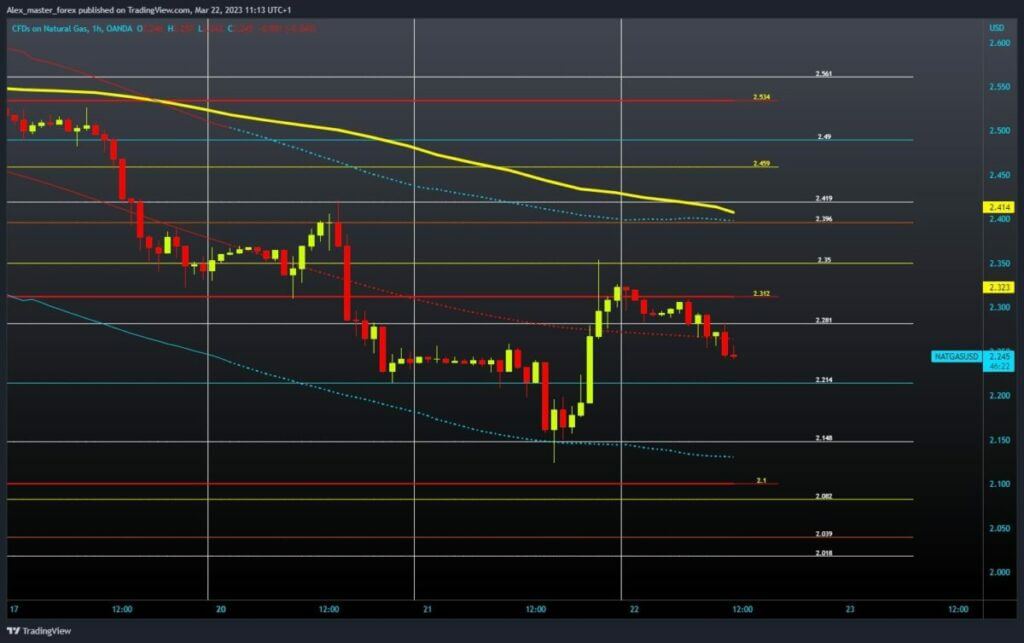
During the Asian trading session, the gas price retreated from the $2.32 level. The price tried to hold above the $2.28 level, but a break was below, and the pullback continued. We are now at the $2.25 level and could go down to the $2.21 level. If we fail to hold here, the price will decrease to yesterday’s support at the $2.14 level.
We need a positive consolidation and a price jump above the $2.32 level for a bullish option. Then we need to stay there if we want to continue with the price recovery. Potential higher targets are the $2.35 and $2.40 levels.


