Oil and natural gas: Oil rises to $73.50 level today
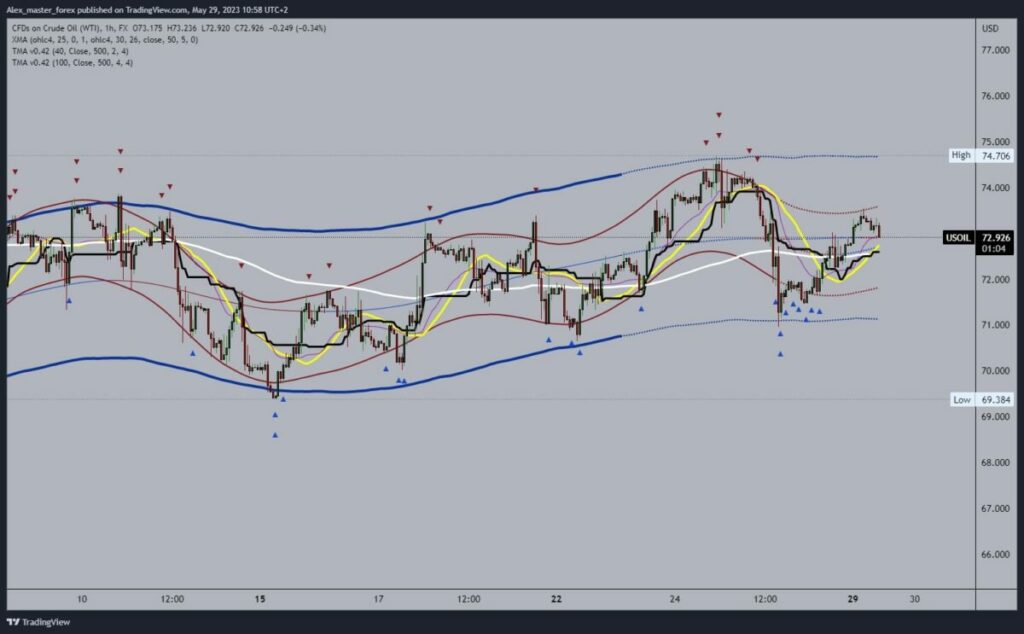
- During the Asian trading session, the price of oil rose to $73.50.
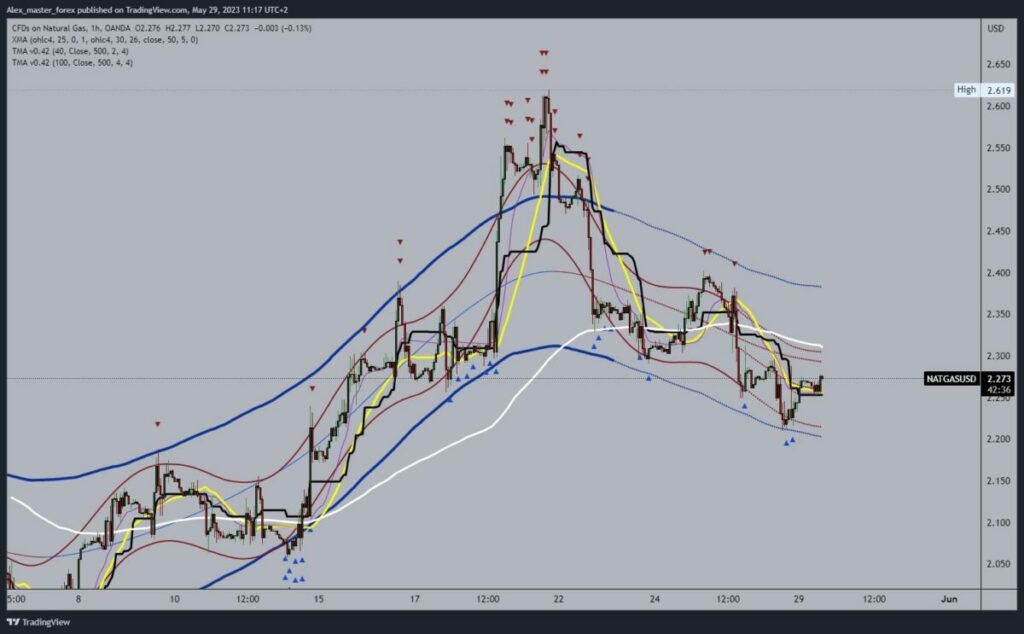
- During the Asian session, the price of natural gas stabilized around the $2.25 level.
Oil chart analysis
During the Asian trading session, the price of oil rose to $73.50. This is where we encounter resistance and see pullbacks to the $73.00 level. The currently present bearish pressure could continue to lower the price of oil to the $72.50 level. Additional support at that level is in the EMA50 moving average.
With a breakout below, we would probably continue the pullback. Potential lower targets are the $72.00 and $71.00 levels. If we manage to consolidate and return above $73.50, potential higher targets are the $74.00 and $75.00 levels.

Natural gas chart analysis
During the Asian session, the price of natural gas stabilized around the $2.25 level. On Friday, the price fell to the 2.20 level and thus formed last week’s low. This is where the price finds support and starts a recovery. The next important level is $2.30; we could expect the next resistance there because we encounter the EMA50 moving average.
If we manage to break above EMA50, then we can expect to continue the recovery. Potential higher targets are the $2.35 and $2.40 levels. We need a negative consolidation and pullback to the $2.20 support level for a bearish option. A break below would mean continued weakness in gas prices. Potential lower targets are the $2.15 and $2.10 levels.


