Oil and Natural gas: Oil price under pressure at $70.00
- During the Asian trading session, the oil price still struggles with the $70.00 level.
- During the Asian trading session, NATGAS managed to stay above the $2.15 level.
Oil chart analysis
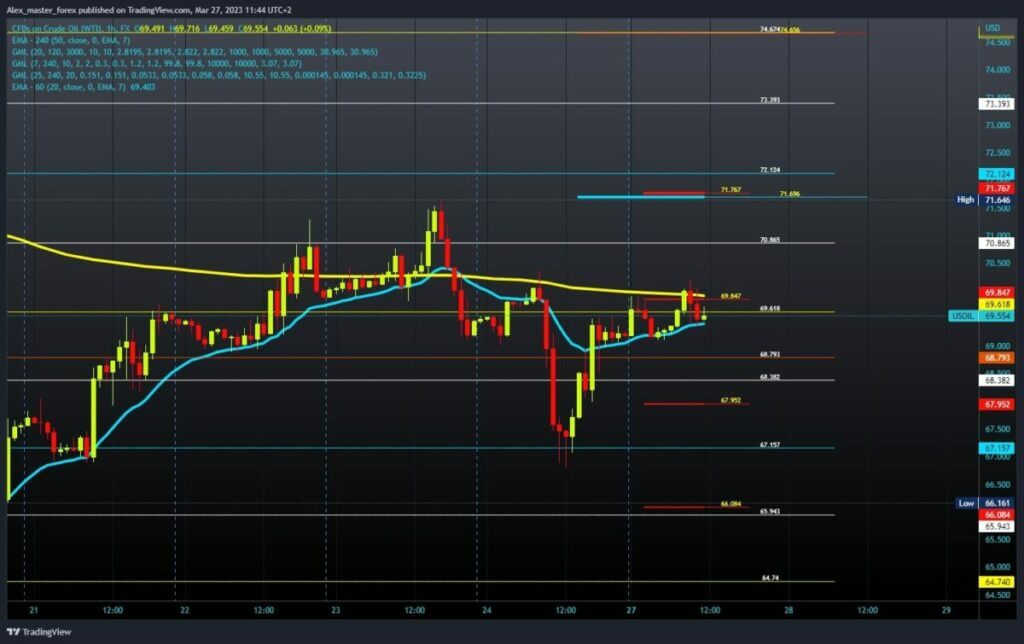
During the Asian trading session, the oil price still struggles with the $70.00 level. Additional pressure at that level creates the EMA50 4H moving average, and we need a break above to see the bullish option’s continuation. If we move above, potential higher targets could be $70.85 and $71.70 levels.
We need a negative consolidation and pullback below the EMA20 1H moving average for a bearish option. After that, we would gradually move to the bearish side. Potential lower targets are $68.80 and $68.40, and last week’s low at $67.15.

Natural gas chart analysis
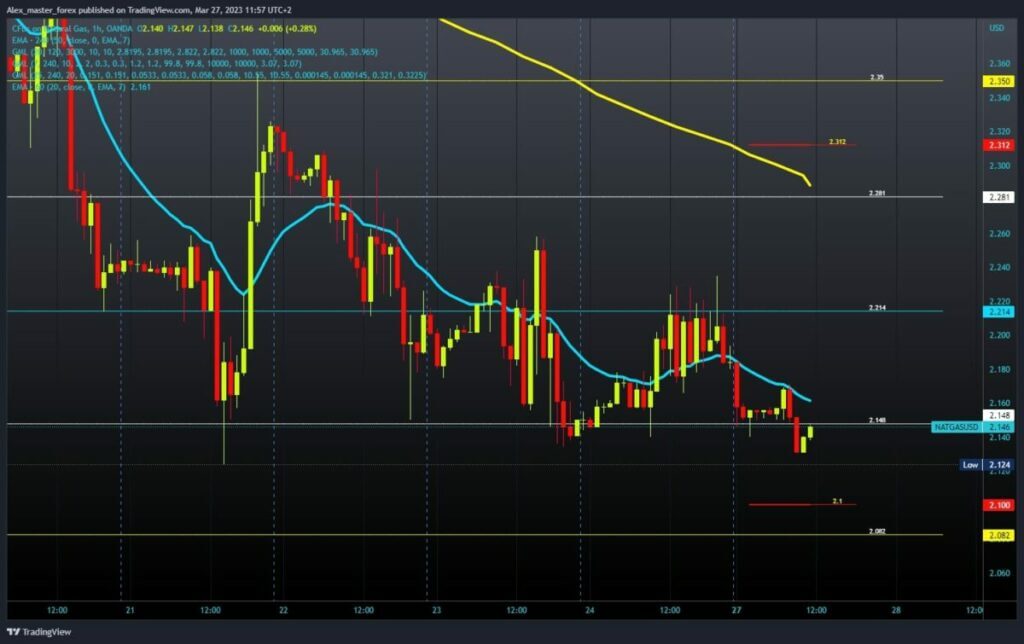
During the Asian trading session, NATGAS managed to stay above the $2.15 level. At the beginning of the European session, the price fell below that level, forming today’s low at $2.13. For now, NATGAS manages to stay above and takes a new step towards the $2.15 level.
We need a price break to the $2.18 level because then we would be above the EMA20 1H moving average. We need further positive consolidation and growth to the $2.20 level to continue the bullish option. Up there, we are very close to the previous resistance zone, around $2.23-2.24, and we need a break above for a more concrete and stronger price recovery. On the bearish side, potential lower targets are $2.10 and $2.08.


