Oil and natural gas: Oil price triggers new pullback
- During the Asian trading session, oil traded at around $79.50.
- The price of natural gas fell back into the critical zone at the $2.45 level yesterday.
Oil chart analysis
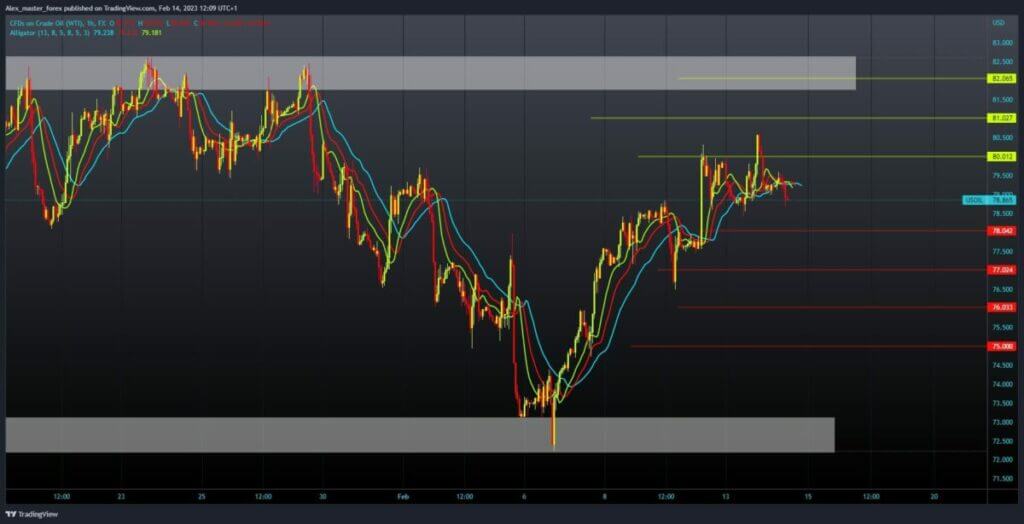
During the Asian trading session, oil traded at around $79.50. Now in the European session, we see a break below that support, and the price of oil fell below the $79.00 level. Today’s low was at the $78.70 level, where we managed to stay above it from behind, but the price pressure is still present. If today’s consolidation continues, we will probably soon find ourselves at the $78.00 level.
A break below could mean a possible continuation of the decline to the next support at the $77.00 level. For a bullish option, we need a new positive consolidation and a price return above the $79.50 level. This would bring us back to the positive side, and we could test the $80.00 level again. If we could manage to stay up, we would have the opportunity to continue the recovery to the resistance zone around the $82.00 level.

Natural gas chart analysis
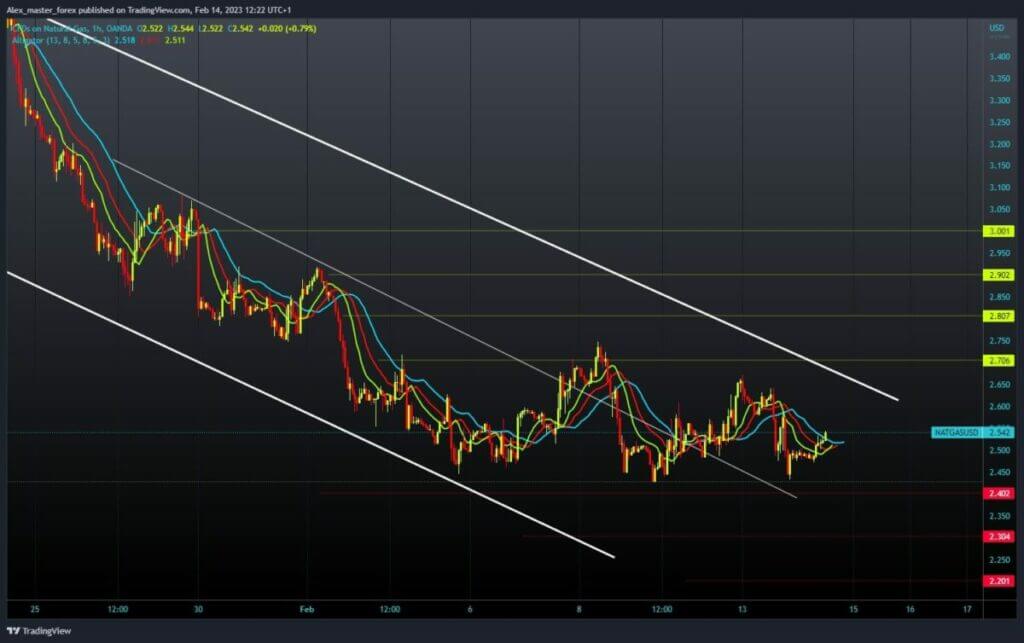
The price of natural gas fell back into the critical zone at the $2.45 level yesterday. During the Asian session, we see a recovery and a jump above the $2.50 level. If this consolidation continues, we could climb up to the $2.60 level. The next potential resistance is at $2.65, then the $2.70 level. In the event that we climb above, then we would have a good chance of continuing to recover and escape from an uncomfortable position.
We need a negative consolidation and newly tested support at the $2.45 level for a bearish option. A break below would be confirmation that we will see a continuation of the inactive scenario for gas prices. Potential lower targets are the $2.40 and $2.30 levels.


