Oil and natural gas: Oil price at $73.00 support level
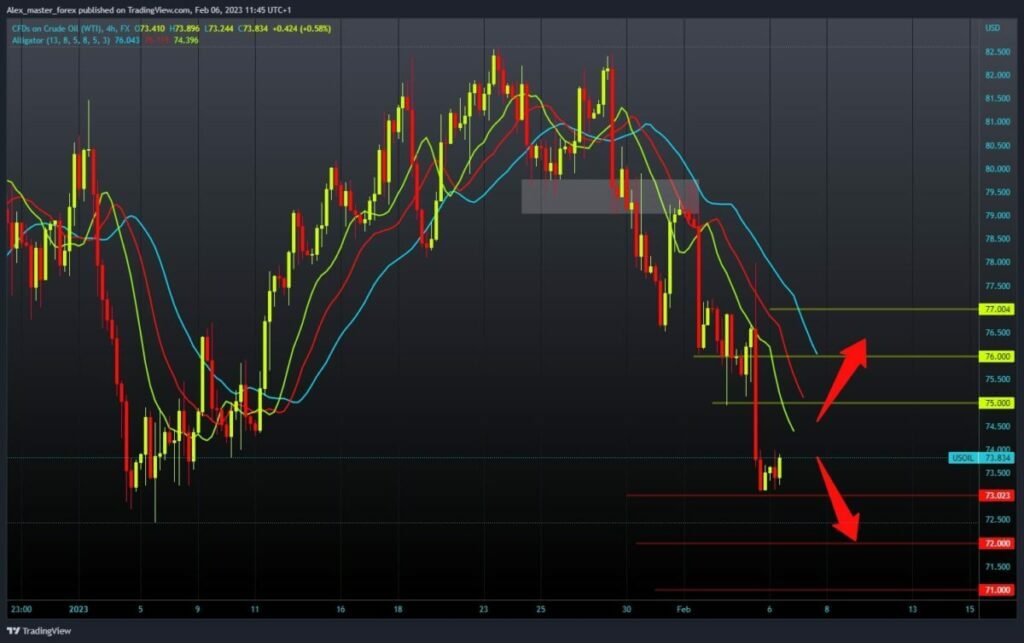
- The oil price fell to $73.10 at Friday’s close of the exchange.
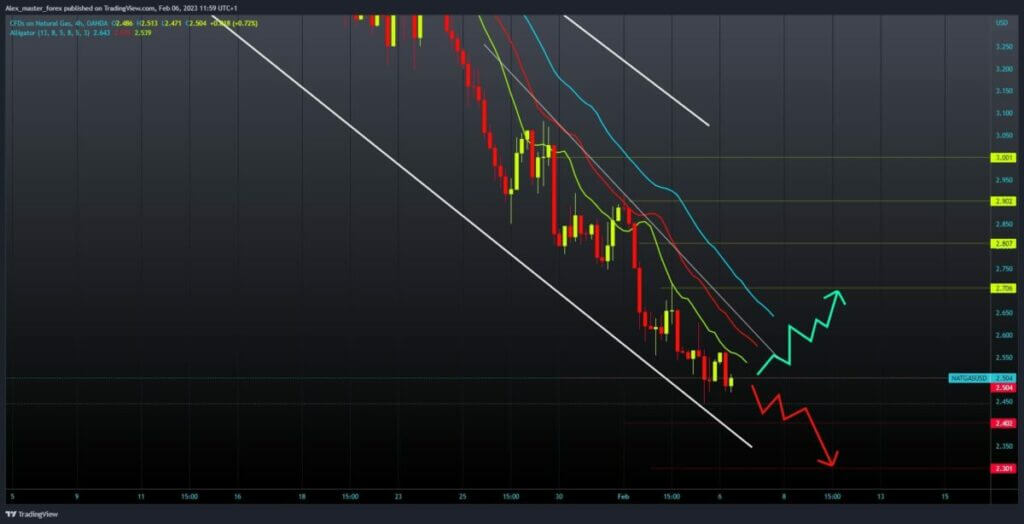
- On Friday, the price of natural gas fell to a new low this year at $2.45.
Oil chart analysis
The oil price fell to $73.10 at Friday’s close of the exchange. During the Asian trading session, the price moved in the range of $73.00-$74.00. If we manage to hold here, a bullish impulse and the initiation of a bullish recovery could occur. Potential higher targets are the $75.00 and $76.00 levels.
We need a negative consolidation and a drop below this morning’s support at the $73.00 level for a bearish option. At the $72.50 level, we will test this year’s low, and a break below would form a new one. Potential lower targets are the $72.00 and $71.00 levels.

Natural gas chart analysis
On Friday, the price of natural gas fell to a new low this year at $2.45. The previous time we were at that level was in April 2021. During the Asian session, the gas price stayed above that level and rose to $2.50. For a bullish option, we need a new positive consolidation and a move above the $2.60 level. This would form a bottom from which the price could start a new bullish impulse and continue the recovery.
Potential higher targets are the $2.70 and $2.80 levels. A price break below the $2.50 level would continue the previous negative consolidation and bearish trend. Potential lower targets below are the $2.40 and $2.30 levels.


