Oil and natural gas: Oil is turning towards the $72.00
- Yesterday’s drop in the dollar dragged the oil price down to $72.28.
- The gas price broke yesterday’s downward trend, finding support at $2.40.
Oil chart analysis
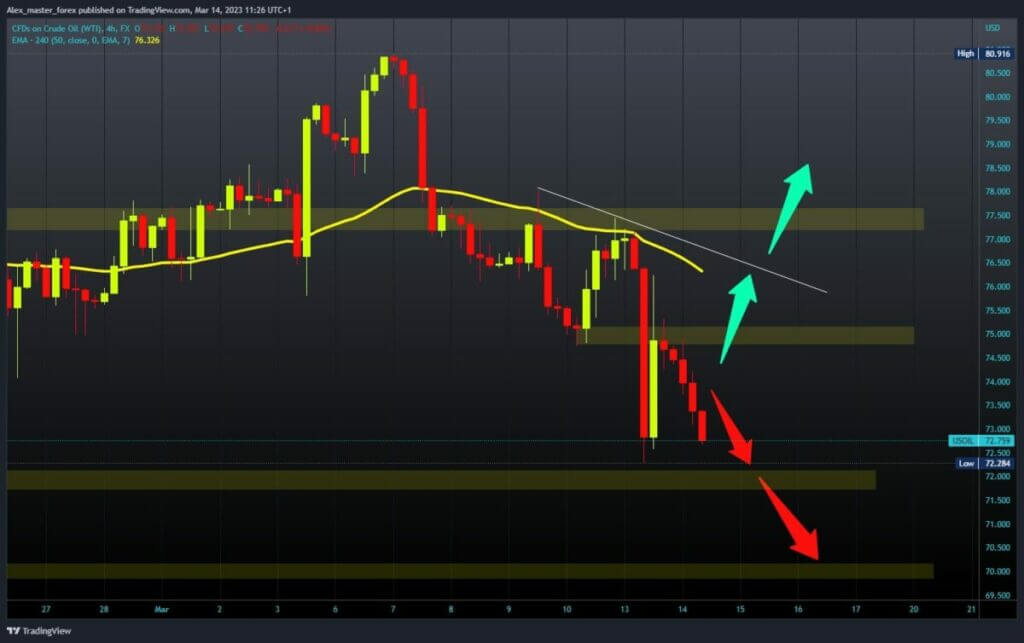
Yesterday’s drop in the dollar dragged the oil price down to $72.28. The price quickly recovered above $76.00, and at the end of the day, it stabilized around the $75.00 level. During the Asian trading session, the price of oil started a new decline, and we are now at $72.75 on the way to the $72.00 support level.
The inability of the oil price to sustain at that level could create a breakout below and fall to the $70.00 level. We need a positive consolidation and a return above the $75.00 level for a bullish option. After that, we need to stay above that, and with a new impulse, we could continue the recovery. Potential higher targets are the $76.00 and $77.00 levels.

Natural gas chart analysis
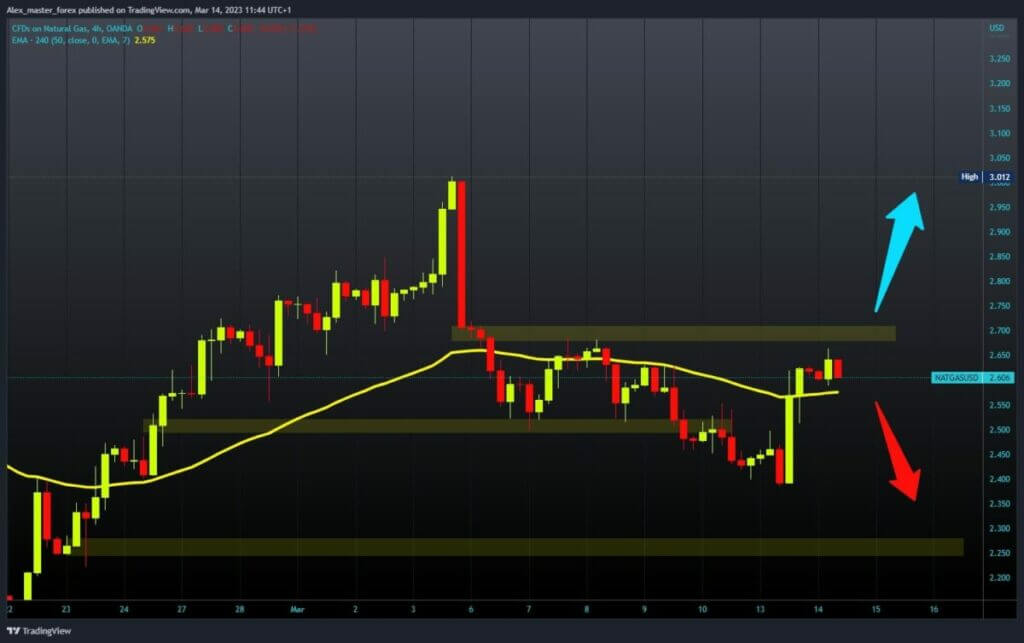
The gas price broke yesterday’s downward trend, finding support at $2.40. After which, we see an impulse that climbs the price to $2.60. During the Asian trading session, the gas price managed to hold on to that level, and now we could expect to see a continuation of the rise.
The first next important level is $2.70; if we break above it, we will be better positioned to start a further recovery. Potential higher targets are the $2.80 and $2.90 levels. We need a negative consolidation and a drop below the $2.55 level for a bearish option. This would bring us back to the bearish side, which could push the gas price to the previous low of $2.40.


