Oil and Natural gas: Oil is testing the $70.0 level
- At the beginning of this week, oil prices continue declining.
- The price of natural gas continues last week’s bullish trend.
Oil chart analysis
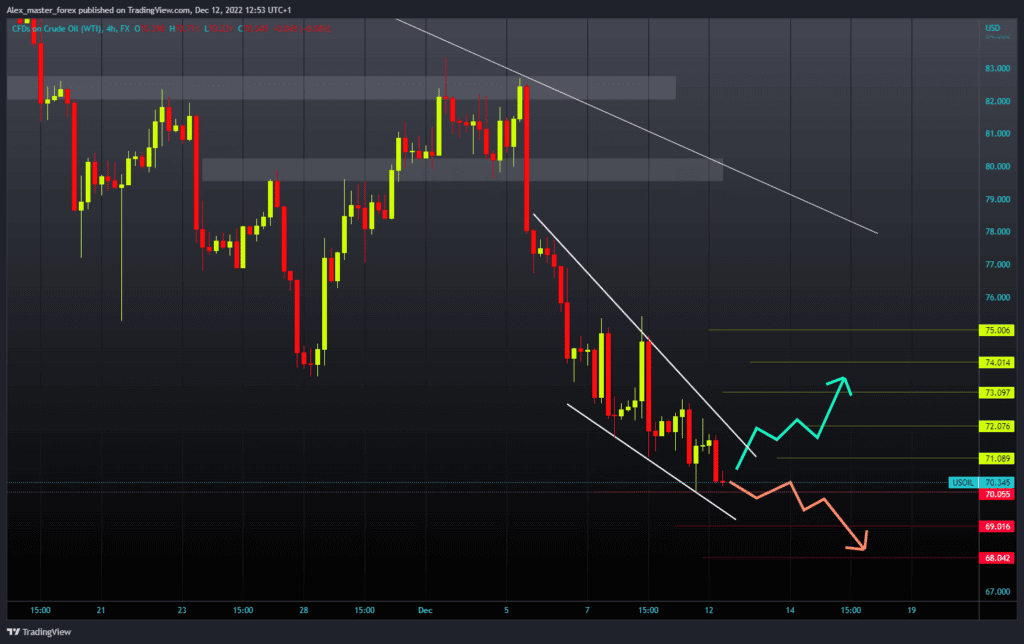
At the beginning of this week, oil prices continue declining. During the Asian trading session, we see a continuation of the decline from $71.80 to the current $70.50 level. It is evident that the price of oil is under great pressure after the EU, G7, and other allies introduced a limit on the price of Russian oil at $60.00. Markets and its participants are on the sidelines now and waiting for developments.
This week is very important because we have a lot of important news regarding the central banks’ monetary policy. So we could expect a further drop in oil prices, as everyone expects major economies to enter a recession. Lower targets on the chart are the $69.00 and $68.00 levels. For a bullish option, we need a positive consolidation and a return to the $72.00 level.
Then, we need to move above and try to stay up there. If we succeed, oil prices could continue their recovery until the next resistance. Potential higher targets are the $73.00, $74.00, and $75.00 levels.

Natural gas chart analysis
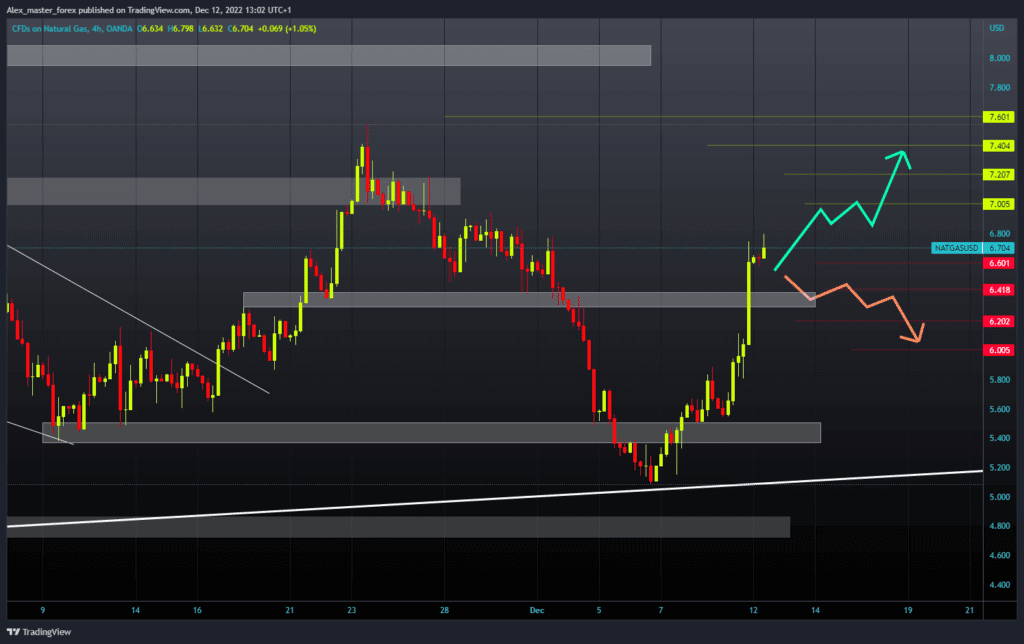
The price of natural gas continues last week’s bullish trend. The price of gas is now well above $6.00. At the opening of the Asian session, we saw a jump in gas prices from $6.00 to almost $6.80. After that, consolidation followed with support at the $6.60 level. If we manage to stay above that level, we will have a chance to continue the growth and climb to the $7.00 level.
In the last week of November, gas prices encountered resistance at that level. Potential higher targets are the $7.20 and $7.40 levels. For a bearish option, we need a negative consolidation and a drop below the $6.60 support level. Then we need to stay down there so that with the next bearish impulse or consolidation, we can continue the decline in gas prices. Potential lower targets are the $6.40 and $6.20 levels.


