Oil and natural gas: Oil falls to the $70.00 level
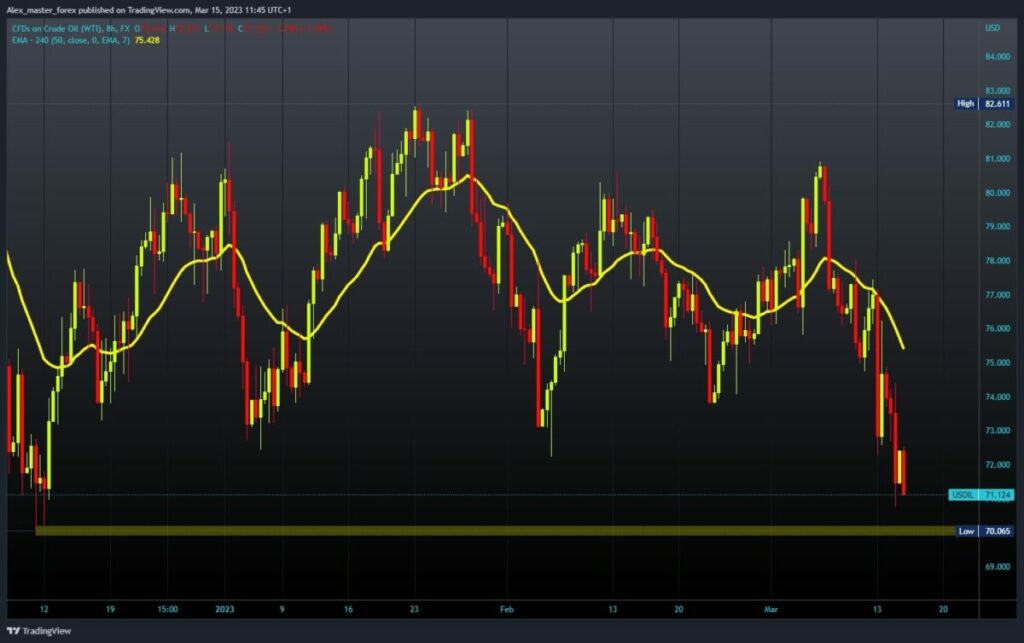
- During the Asian trading session, the oil price recovered from $71.00 to $72.40.
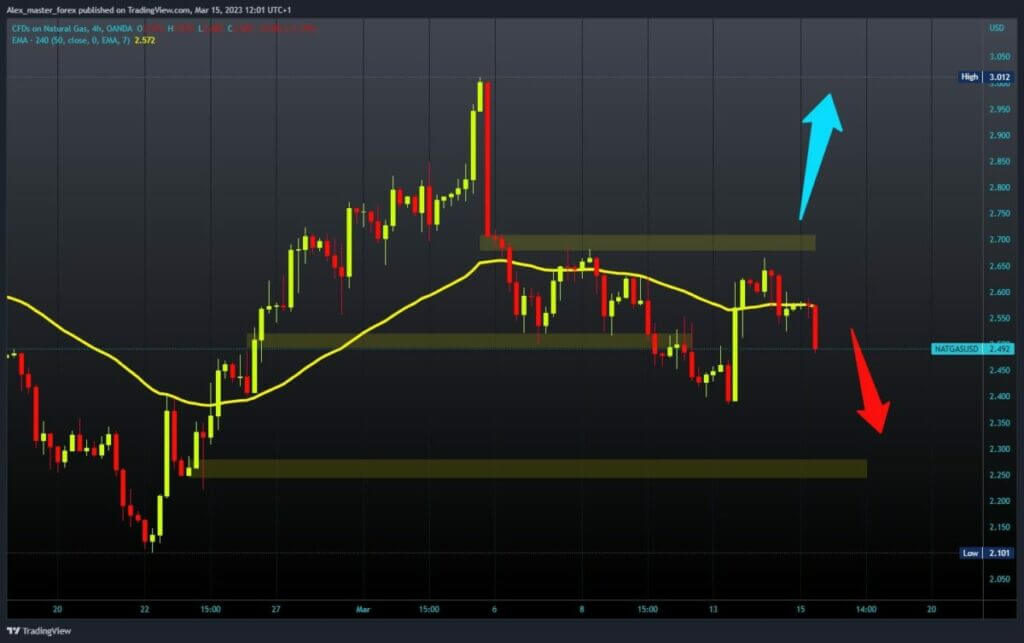
- Yesterday’s attempt by the gas price to make a more concrete bullish recovery was stopped at the $2.65 level.
Oil chart analysis
During the Asian trading session, the oil price recovered from $71.00 to $72.40. Now we again see pressure on the price of oil and a new retreat to the $71.24 level. The price could test the $70.00 level if the current trend continues. The last time the price of oil was $70.00 was on December 11 last year.
We need a positive consolidation and a return above the $72.00 level for a bullish option. With that, the price would stop the fall and form a new bottom from which it could start the continuation of the recovery. Potential higher targets are the $73.00 and $74.00 levels.

Natural gas chart analysis
Yesterday’s attempt by the gas price to make a more concrete bullish recovery was stopped at the $2.65 level. The price then initiates a pullback to the $2.55 level. During the Asian trading session, the gas price managed to stay at that level. In the European session, the pressure on the price increased, and it started a new decline and is now at the $2.48 level. If the current movement continues, the next target is the $2.40 support level.
We need a positive consolidation and a return above the $2.60 level for a bullish option. That would put us close to testing resistance at $2.65 again. a price break above and staying up would mean further recovery. Potential higher targets are the $2.70 and $2.80 levels.


