Oil and Natural Gas: Oil at $72.00 support level
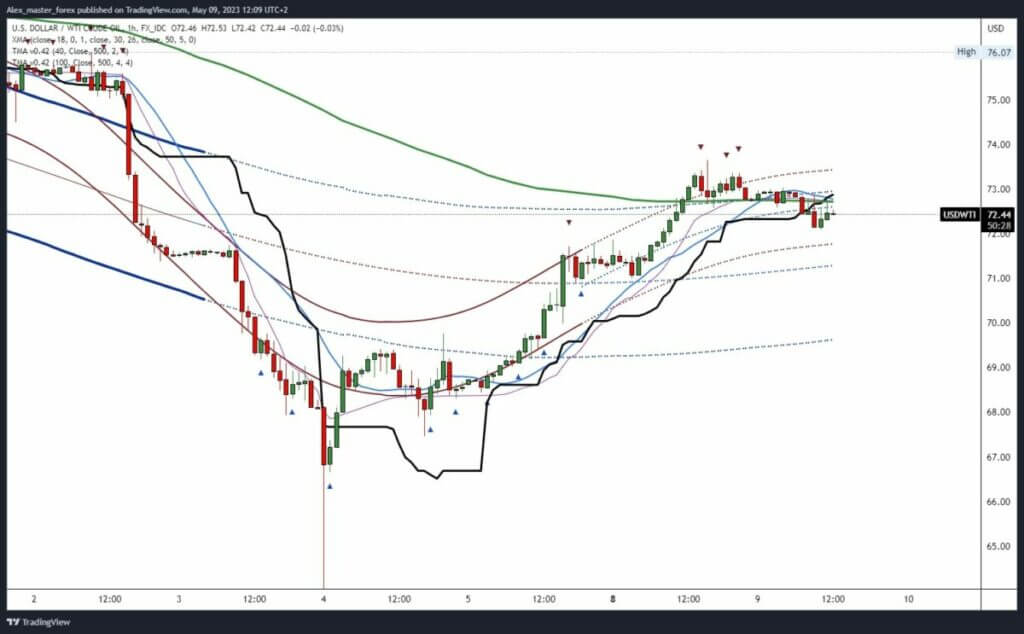
- The oil price growth stopped at the $73.65 level yesterday.
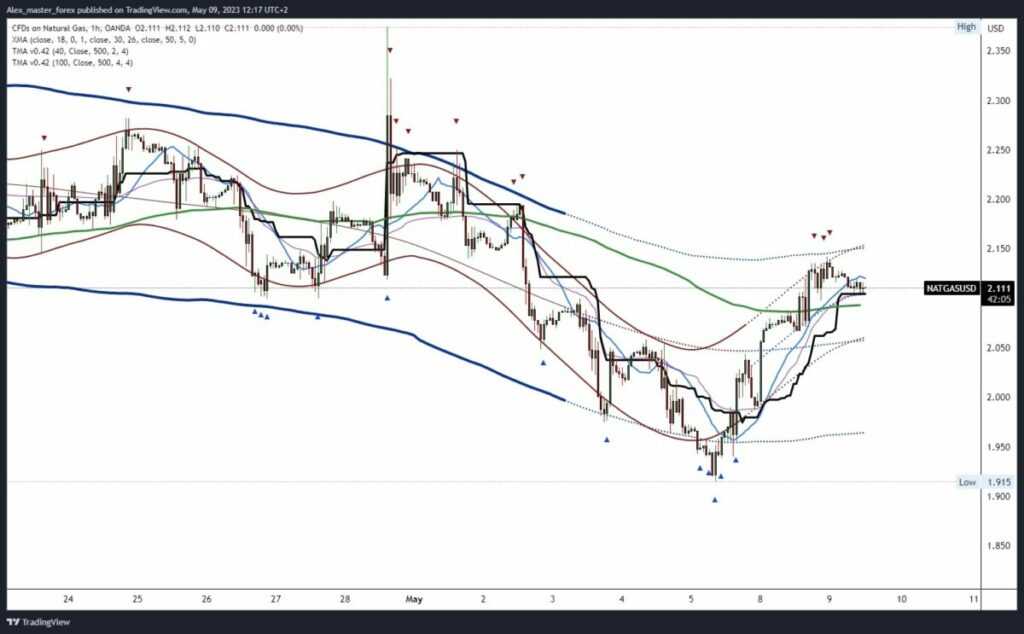
- Yesterday’s natural gas price recovery was stopped at the $2.14 level.
Oil chart analysis
The oil price growth stopped at the $73.65 level yesterday. From that moment, the price of oil began to retreat. During the Asian session, the price continues to fall below the $73.00 level, and this morning’s low price is $72.10. Now we see a minor recovery to $72.50, but we are still under bearish pressure.
The current picture tells us that the decline could continue and look for support at some lower level. Potential lower targets are the $71.50 and $71.00 levels. We need a positive consolidation and a move above the $73.00 level for a bullish option. After that, we would get support in the EMA50 moving average, which should have a positive effect and push the price to higher levels. Potential higher targets are the $73.50 and $74.00 levels.

Natural gas chart analysis
Yesterday’s natural gas price recovery was stopped at the $2.14 level. During the Asian trading session, the price retreated to the $2.10 level; for now, we are holding above that level. A smaller bounce to $2.13 could push the price to retest last night’s high. This could lead to a break above and continued growth to $2.15, then to $2.20.
We need a negative consolidation and a price drop below the $2.10 support level for a bearish option. Additional price support at that level is in the EMA50 moving average. A pullback below gas prices would likely slide and visit lower support levels. Potential lower targets are the $2.08 and $2.06 levels.


