


Oil and Natural Gas: Instability
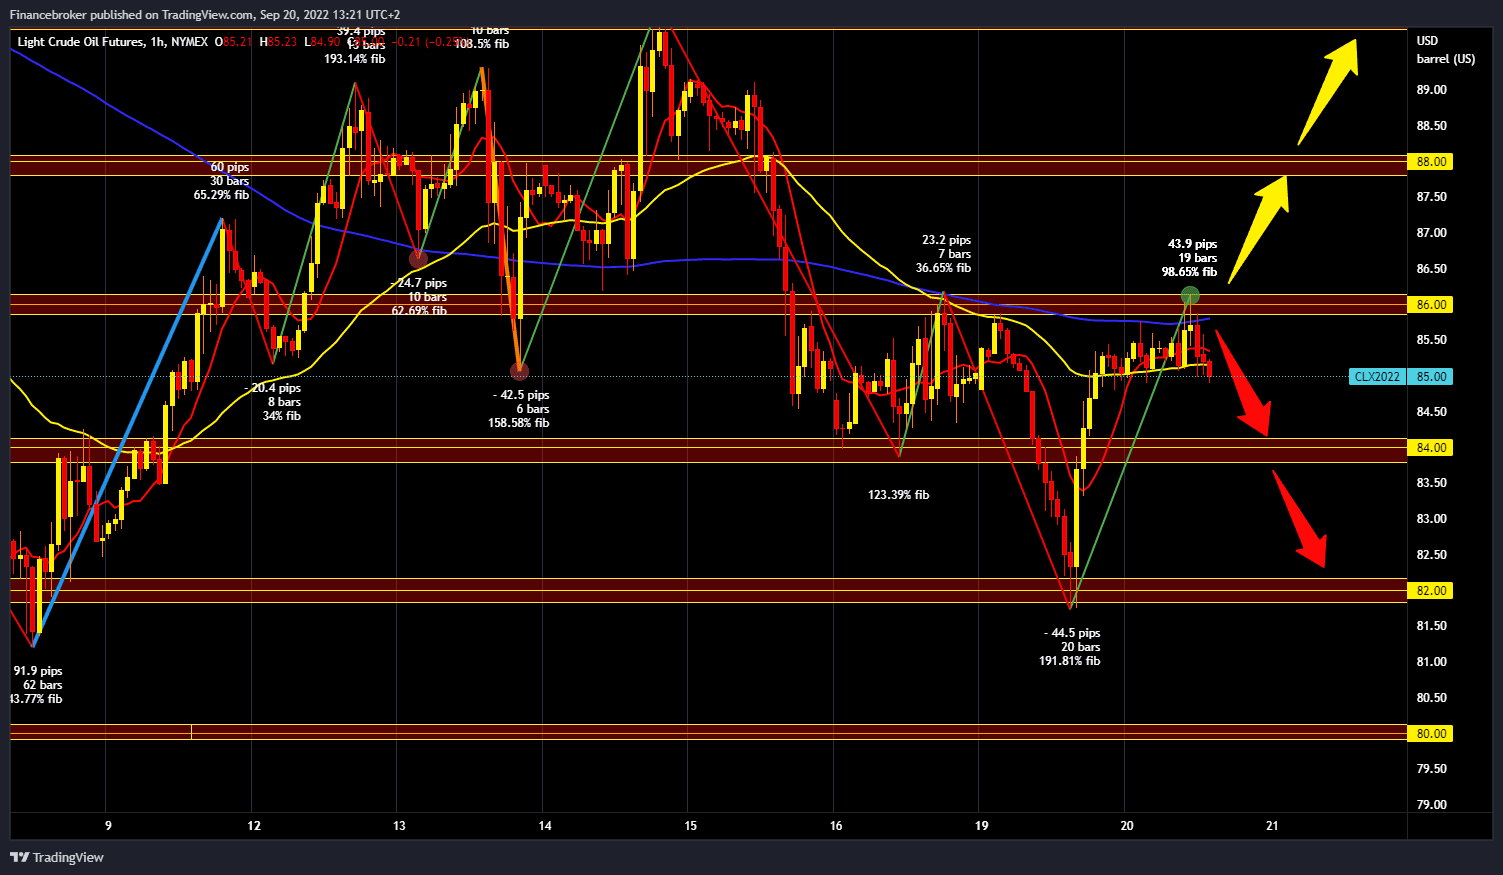
- After yesterday’s fall in the oil price to the $82.00 level, a quick recovery followed above the $84.00 level.
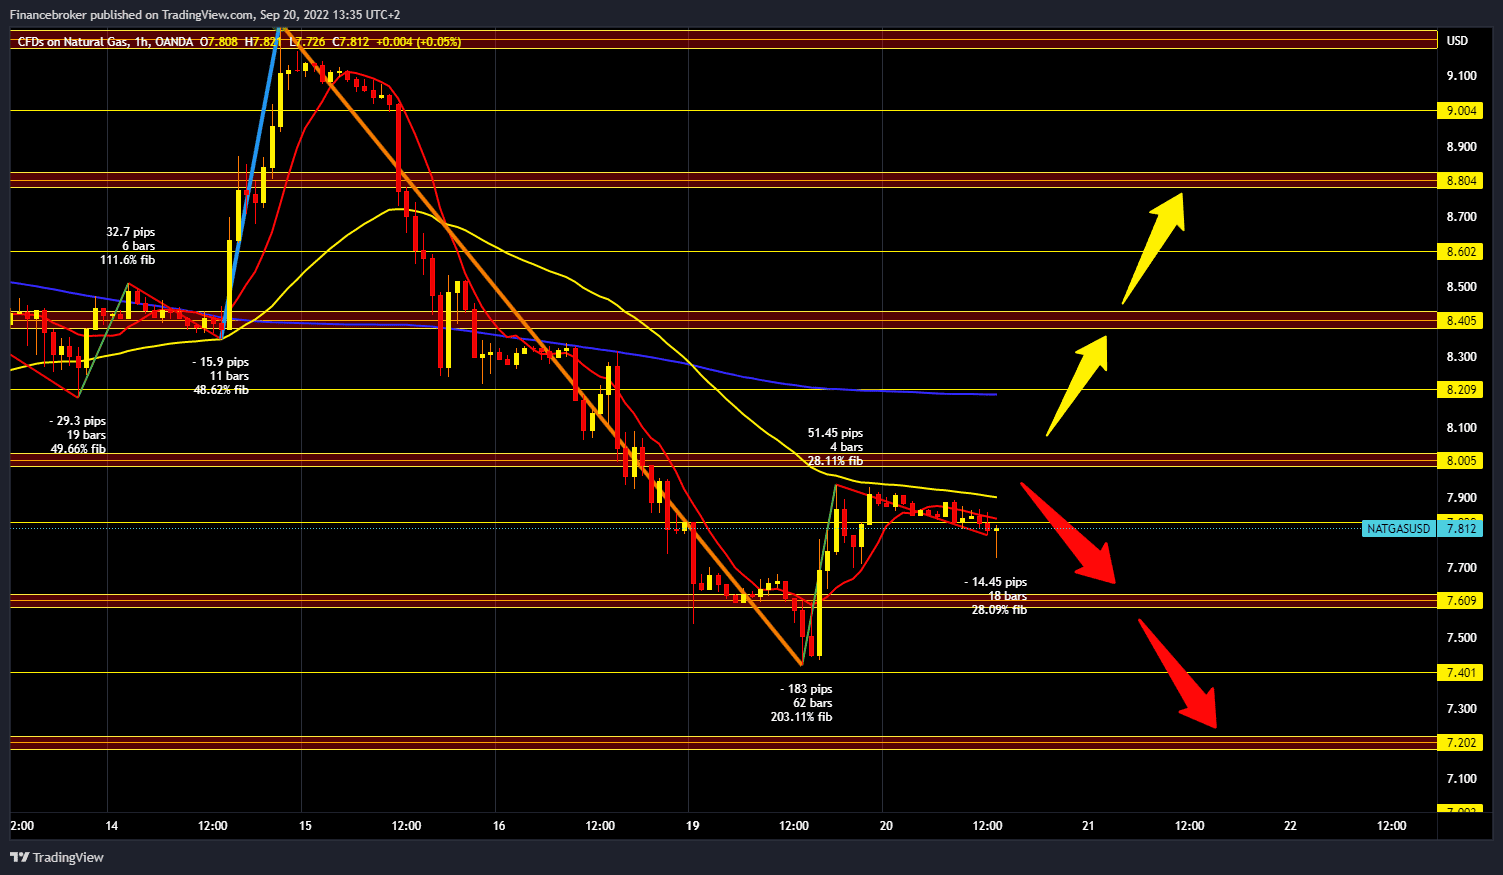
- The price of gas stopped yesterday at the $7.90 level, and we did not manage to climb above the $8.00 level.
Oil chart analysis
After yesterday’s fall in the oil price to the $82.00 level, a quick recovery followed above the $84.00 level. Today, the price managed to reach the $86.00 level, and for now, we have an obstacle at that level. The price is pulling back again, and we are now at the $85.00 level. We could see a further pullback to the $84.00 support level. If we do not find support at that level again, we will again find ourselves at $82.00, the previous low. A break below could also happen; potential lower targets are $81.00 and $80.00. We need a positive consolidation and break of oil prices above the $86.00 level for a bullish option. Then, we must stay above and continue the growing trend with a new bullish impulse. Potential higher targets are $87.00 and $88.00 levels.
Natural gas chart analysis
The price of gas stopped yesterday at the $7.90 level, and we did not manage to climb above the $8.00 level. During the Asian trading session, the can was not in a bearish consolidation, and now we are below the $7.80 level with an eye on the 7.60 $ support level. If we don’t manage to hold on there either, the lower target is $7.40, yesterday’s low. We need a new positive consolidation and a price break above the $8.00 level for a bullish option. THEN we must hold above and continue the rising trend with a new bullish impulse. Potential higher targets are $8.20 and $8.40 levels. Additional resistance in the MA200 can be expected in the zone around the $8.20 level.
Market overview
Tonight, The American Petroleum Institute reports inventory levels of US crude oil, gasoline and distillates stocks.

