


Oil and Natural Gas: For the first time since 2008
- The price of oil is in a bullish trend for the fourth day after falling to the $86.00 level on August 16.
- For the first time since 2008, the price of natural gas managed to reach the level of $10.00.
- Russian state energy company Gazprom announced on Friday that a key gas pipeline that brings gas to Europe would be closed for three days at the end of the month for routine maintenance.
Oil chart analysis
The price of oil is in a bullish trend for the fourth day after falling to the $86.00 level on August 16. On Friday, we tried to climb up to the $92.00 level, and we missed a bit, a pullback soon followed, and the price once again found itself below the $90.00 level. We found support at the $88.30 level. Since then, we are in a new bullish impulse with the current obstacle at the $91.00 level.
For a bullish option, we need a continuation of the positive consolidation and to manage to hold above the $90.00 level. If we succeed, we could see a new bullish impulse up to the $92.00 level. Potential higher targets are $93.00 and $94.00 levels. We need a negative consolidation from the current position and a new price drop below the $90.00 level for a bearish option. Additional potential support at that level is in the MA20 and MA50 moving averages. A break in oil prices below would take us down to the $88.00 support zone. Potential lower targets are $87.00 and $86.00, last week’s low.

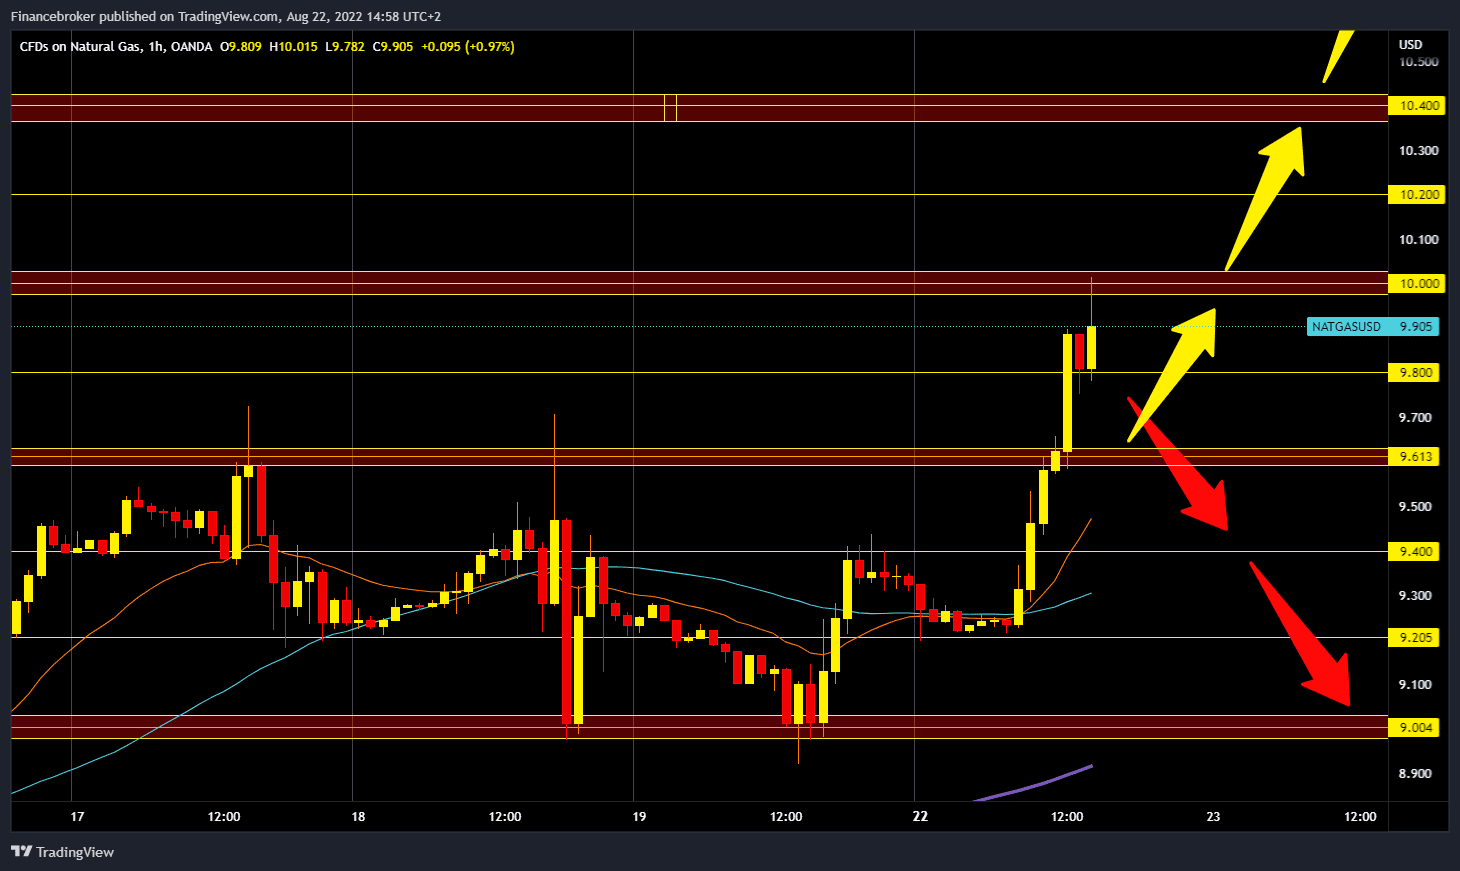
Natural Gas Chart Analysis
For the first time since 2008, the price of natural gas managed to reach the level of $10.00. During the Asian trading session, the gas price consolidated at the $9.20 level, followed by a bullish impulse that first took us to the $9.60 level. The gas price continued to move towards $9.80, where it stayed for a while before jumping to the $10.00 level. We now have a short pullback to the $9.90 level.
For a bullish option, we need a continuation of the positive consolidation and a new breakout of gas prices above the $10.00 level. After that, we need the next bullish impulse to continue to higher targets. Potential higher targets are the $10.20 and $10.40 levels. For a bearish option, we need a downside consolidation and a drop in the gas price to the $9.60 support level. If we do not find support there and the price continues to fall, the potential lower targets are $9.40 and $9.20. In that zone, moving averages MA20 and MA50 can provide us with additional support.
Market Overview
Russian state energy company Gazprom announced on Friday that a key gas pipeline that brings gas to Europe would be closed for three days at the end of the month for routine maintenance. Gazprom announced that the only operational turbine at a key compressor station along the Nord Stream 1 pipeline, which connects western Russia and Germany, will be shut down for routine maintenance from August 31 to September 2. The announcement adds that routine maintenance will be carried out with Siemens experts. The announcement raises further fears that Russia could completely shut off the gas, which is used for industry, power generation, and heating.

