


Oil and Natural Gas fell sharply
- Oil fell sharply this morning at the opening of the trading day from $ 118.00 to $ 114.50.
- The price of natural gas yesterday failed to break the $ 8.00 barrier.
- Without a nuclear deal with Iran, the US Treasury Department has imposed more sanctions on corporations based in Iran.
Oil analysis chart
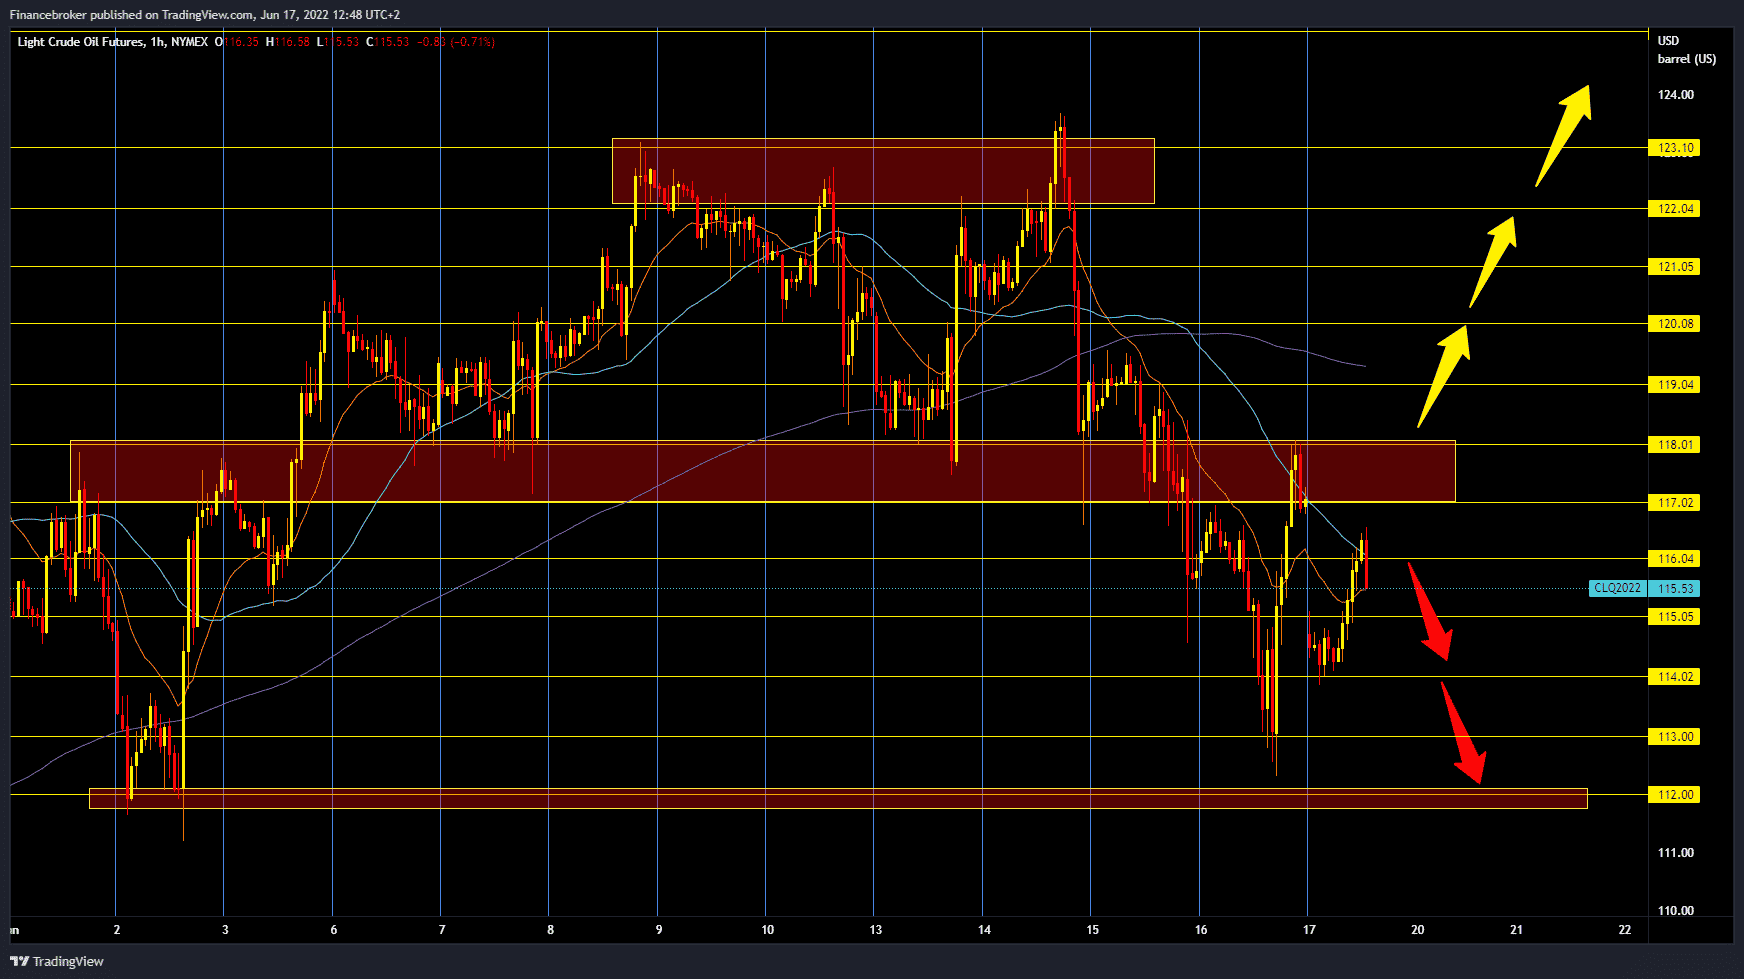
Oil fell sharply this morning at the opening of the trading day from $ 118.00 to $ 114.50 as concerns arose over demand after interest rates rose during the week, although new sanctions on Iran have limited the decline. As of this morning, the price has recovered to 116.10 dollars. Central banks across Europe raised interest rates on Thursday and hinted at even higher credit costs to tame rising inflation, which undermines savings and reduces corporate profits.
The United States on Thursday imposed sanctions on Chinese and Emirati companies and a network of Iranian companies that help Iranian export petrochemicals, a move that could aim to increase pressure on Tehran to renew Iran’s 2015 nuclear deal. For the bullish option, we now need a return above yesterday’s high at $ 118.00. After that, we could expect the oil price to continue its bullish trend towards $ 120.00. In the zone around $ 119.00, we come across the MA200 moving average. If we overcome all that, the price could test this week’s high at $ 123.00. For the bearish option, we need negative consolidation and pullback to the previous support in the zone around $ 114.00. If oil prices continue to weaken further, our next support zone is at the $ 112.00 level.
Natural gas chart analysis
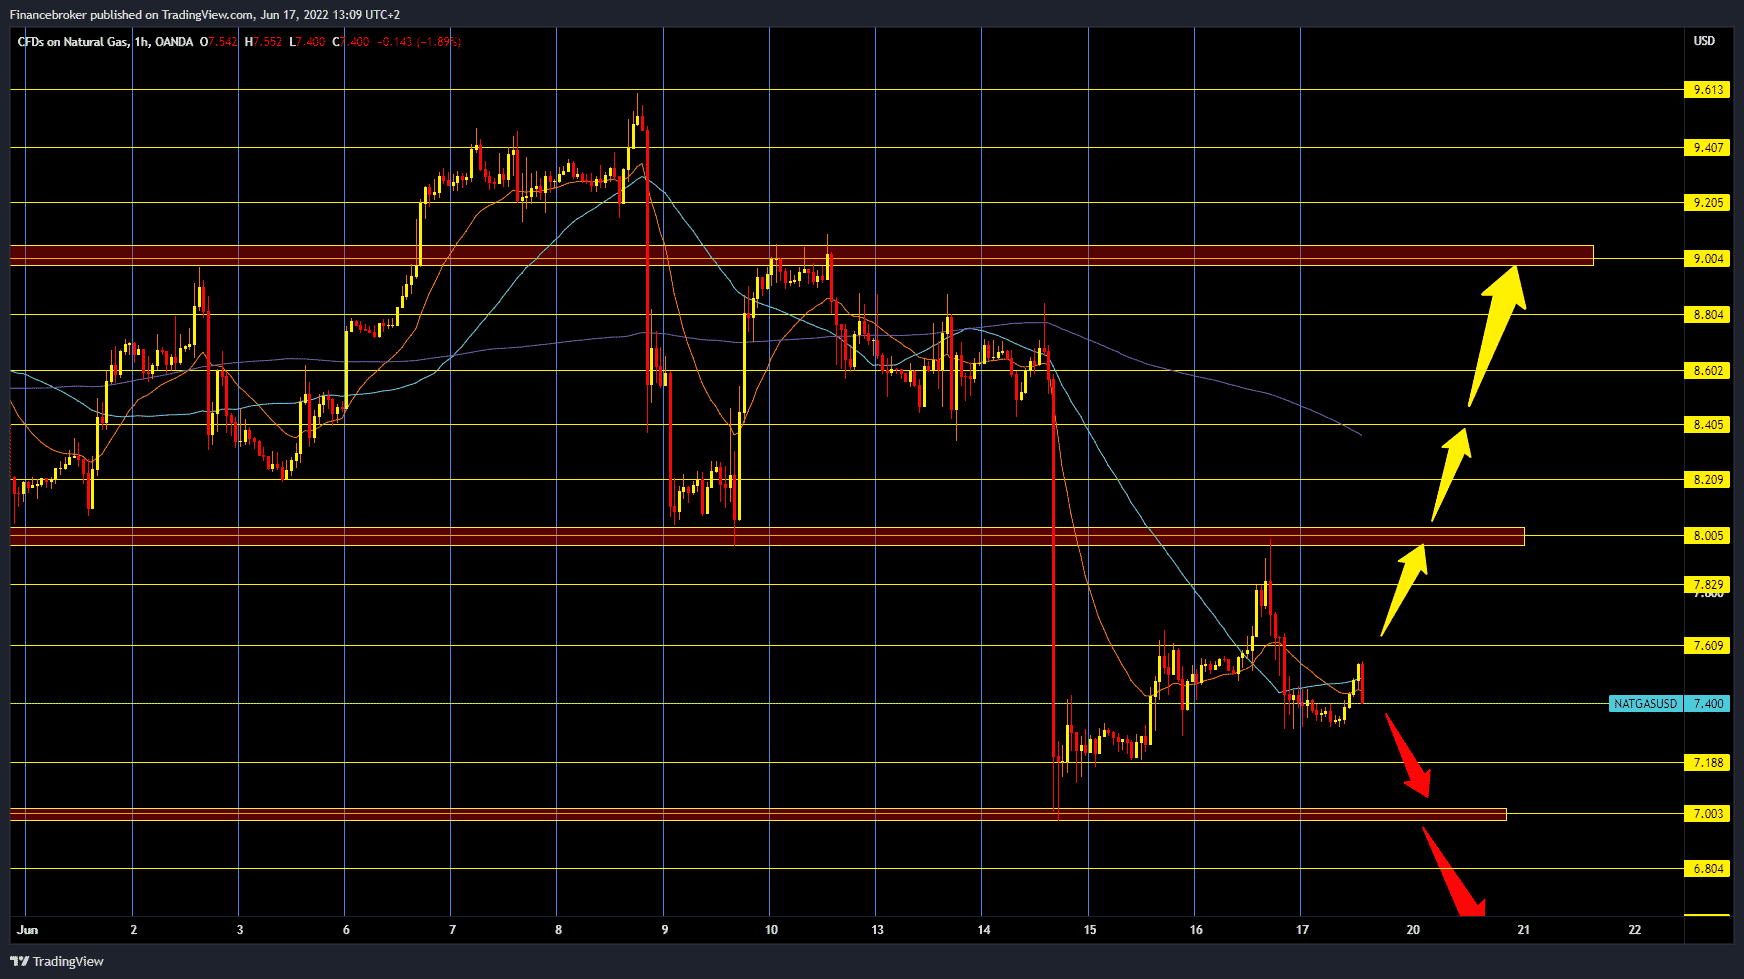
The price of natural gas yesterday failed to break the $ 8.00 barrier. In contrast, the gas price triggered a new pullback to $ 7.40. During the Asian trading session, the price managed to consolidate at that level and started a new bullish impulse. For the bullish option, we now need to continue this positive consolidation and break above $ 7.60. After that, the gas price could test yesterday’s resistance at $ 8.00. A price jump above that level would take us back to the previous consolidation zone between $ 8.00-9.00. For the bearish option, we need a pullback below $ 7.40. After that, the space opens up to us for $ 7.00.
Market overview
U.S. impose additional sanctions on Iran
Without a nuclear deal with Iran, the US Treasury Department has imposed more sanctions on corporations based in Iran, China, and the UAE for allowing the export of Iranian petrochemical products.
On Thursday, the US Treasury Department’s Office of Foreign Assets Control (OFAC) imposed new sanctions on what is called a “network of Iranian petrochemical producers” and “company firms” in China and the UAE that support Iran’s petrochemical exports.
“This network is helping to conduct international transactions and avoid sanctions, supporting the sale of Iranian petrochemical products to clients in the PRC and the rest of East Asia,” the finance ministry said in a statement.
In particular, the Ministry of Finance announced that the network enables the sale of petrochemical products “hundreds of millions of dollars” from the Iranian Oil Company to foreign buyers, including China.

