

Oil and Natural Gas: 100 level up?
- During Asian trading, the price of crude oil once again rose above the 100 level.
- During yesterday’s day, the price first broke the $5.60 level and then followed a bullish impulse to the $6.30 level.
- Oil prices may be falling, but oil is still going toward $140 a barrel, Goldman Sachs told CNBC on Thursday, and could even reach $140 in the event of a recession.
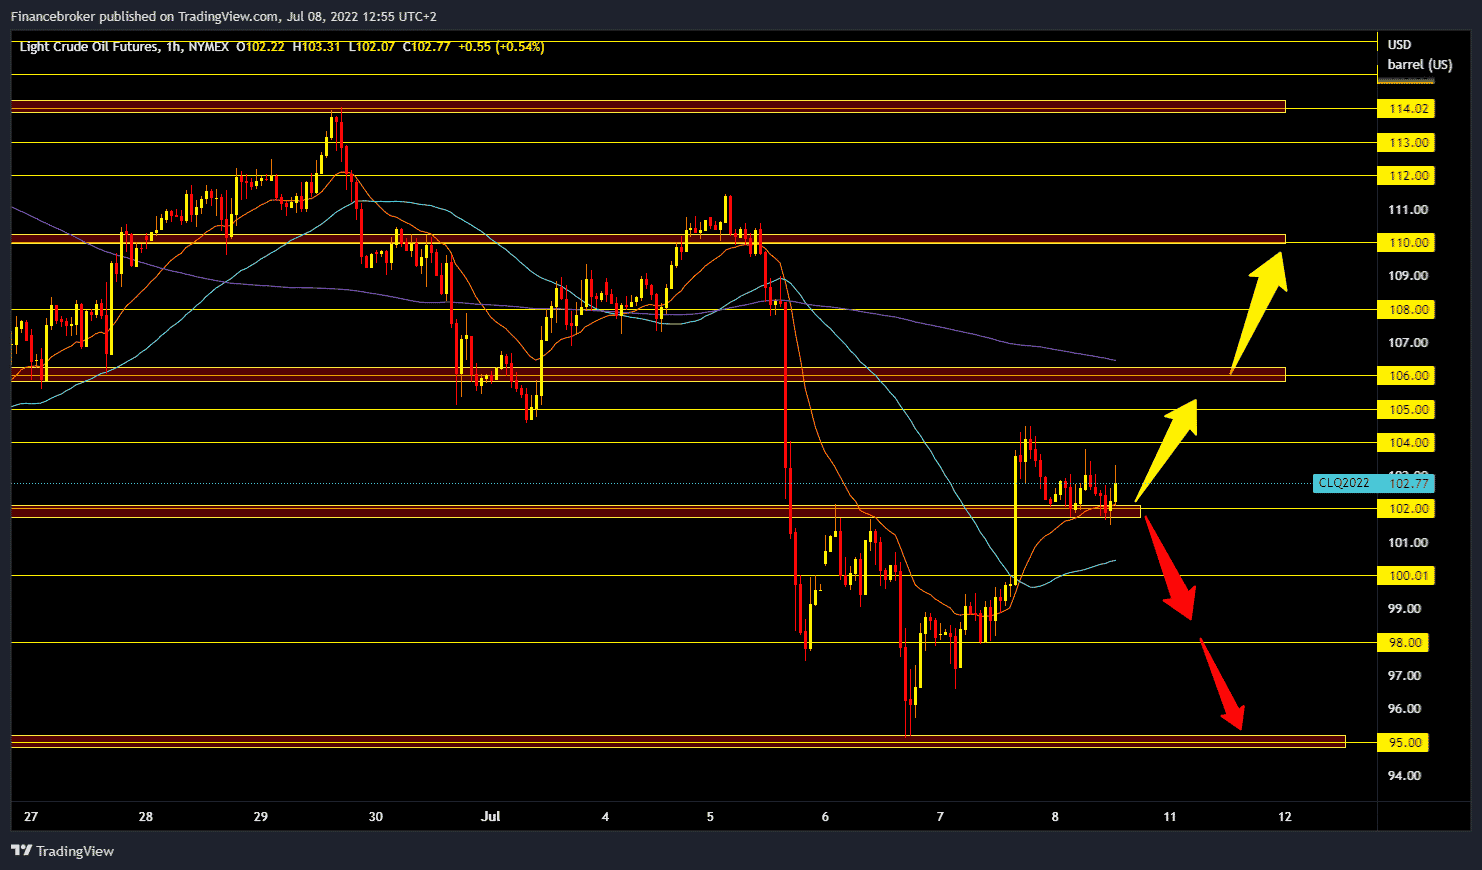
Oil chart analysis
During Asian trading, the price of crude oil once again rose above the 100 level. The official government report on US inventories showed yesterday that US crude oil inventories rose by 8.235 million barrels, but a much larger drop in gasoline inventories was a surprise. U.S. inventories are at their lowest level since 2004 as refineries run near full capacity. For example, plants on the American coast of the Gulf of Mexico are at about 98% utilization, the highest in the last three and a half years. Crude oil is trading at $102.75 a barrel, up 0.03% from early trading overnight. Yesterday, the price of oil jumped to $104.50, after which we see a consolidation that continues in the range of $102.00-104.00. We need a price break above the $104.00 level for a bullish option. After that, the price could climb up to the $106.00 resistance zone.
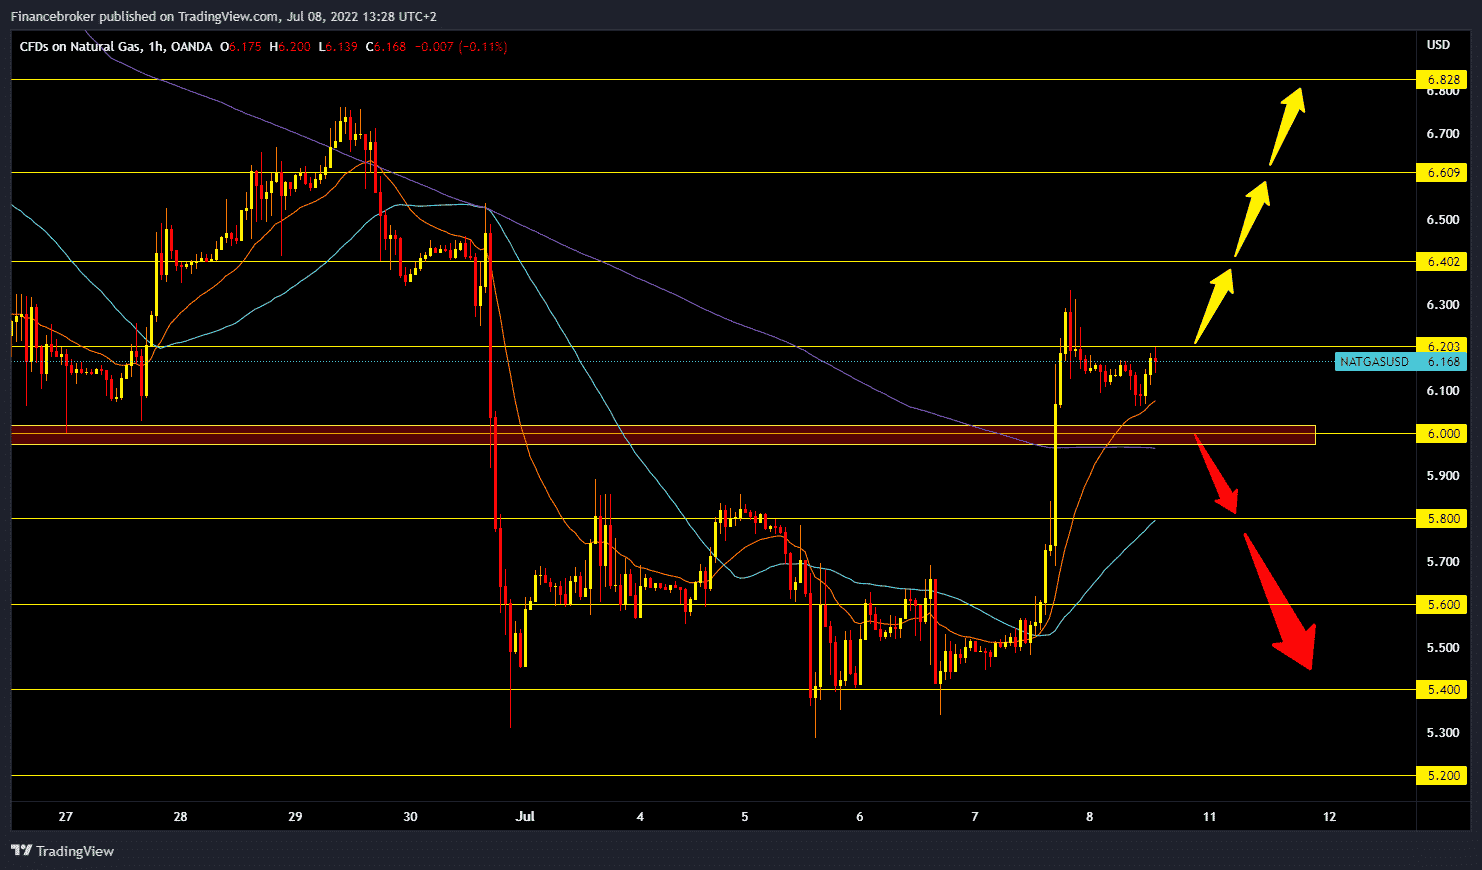
Natural gas chart analysis
During yesterday’s day, the price first broke the $5.60 level and then followed a bullish impulse to the $6.30 level. The jump was 16.5%. During the Asian session, the price pulled back to support at $6.00, and after that, the gas price started a new bullish impulse. The gas price is now at $6.20, representing an increase of 0.34% since the beginning of trading last night. We need a break above the $6.20 level for a bullish option. Then we need a positive consolidation for further continuation. Potential higher targets are $6.40, $6.60 and $6.80 levels. We need a negative consolidation and a drop below the $6.00 level for a bearish option. Then the price could continue the pullback to the previous support zone. Potential lower targets are $5.80 and $5.60, and $5.40.
Market overview
Oil prices may be falling, but oil is still going toward $140 a barrel, Goldman Sachs told CNBC on Thursday, and could even reach $140 in the event of a recession.
“$140 remains our base case because, unlike equity, which is an anticipatory asset, commodities need to resolve today’s supply and demand mismatch,” said energy analyst Damien Courvalin.
At the time of the first crisis, oil prices rose even during the first six months of the market downturn, bolstered by tight supplies as supplies continued to shrink, Courvalin explained. Finally, oil prices were pulled back by the slowing economy. Goldman sees it happening again.
Crude oil WTI and Brent rallied on Thursday, managing to regain ground lost earlier this week when both benchmarks fell below $100 a barrel. The market remains fundamentally tight, but temporary factors, including China’s recently announced plan to consider a $220 billion stimulus with bond sales and fears of a recession, have provided a strong boost to oil prices this week.

