NZD/USD forecast for January 19
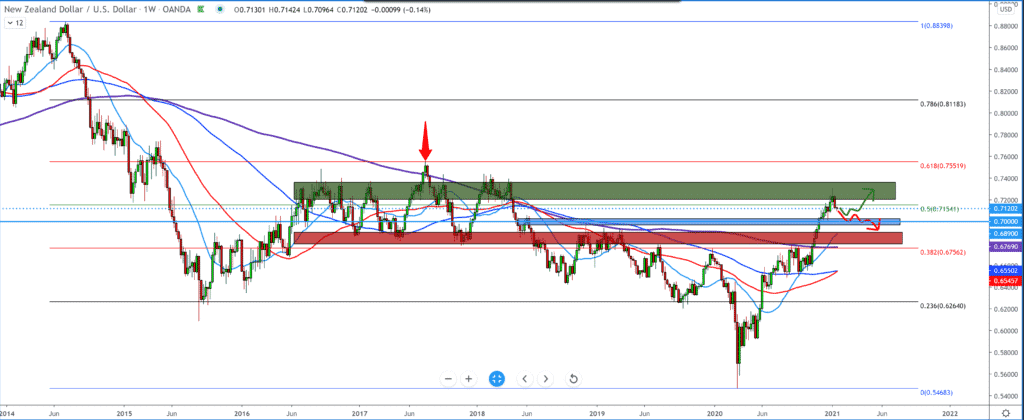
Looking at the chart on the weekly time frame, we see a large resistance zone at 0.72000-0.74000 from 2016-2018. after falling from 0.73000, we can now expect to see a pullback to the psychological area of 0.70000. By setting the Fibonacci retracement level, we see that the pair is currently testing the level at 50.0%. The bullish scenario from March 2020 is still in force due to the weak dollar, whose movement is still unpredictable due to the unstable political situation.

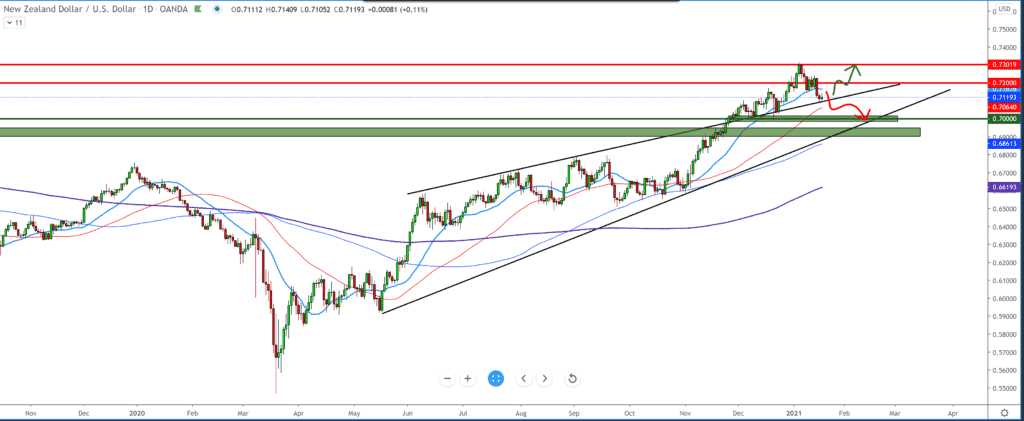
On the daily time frame, we see the pair moving above the top line of the rising channel and bouncing up, but with resistance at 0.73000, at 0.72000, we see a consolidation that failed to climb the pair up, but the pair slid down looking for better support. It is now at the current 0.71200, and there is a chance that the couple will test the psychological level of 0.70000 again. For the bearish scenario, the first step was made with a break below the moving average of MA20 (light blue line), while at 0.70600, MA50 (red line) is waiting for us as support. The second scenario is a deduction from the trend line and a continuation up again above 0.72000.

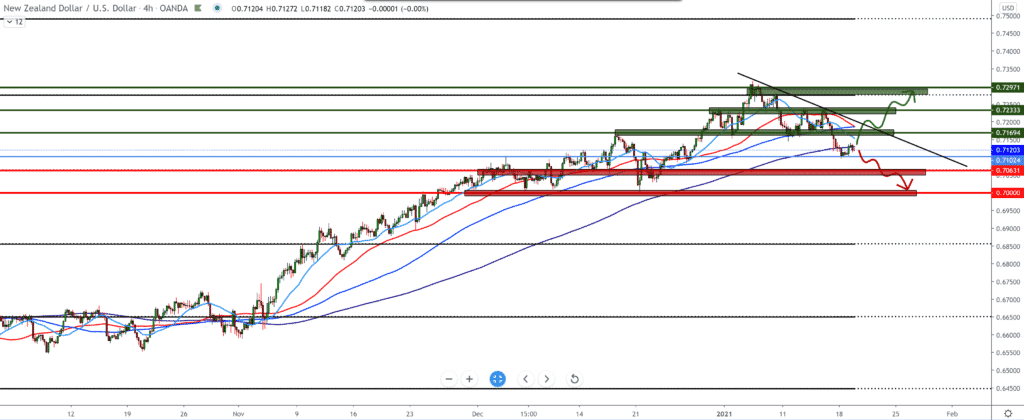
We see that the New Zealand dollar is losing control on the four-hour time frame after arriving in the zone at 0.73000. The date coincided with January 6, when there was an electoral count in the US Congress. Looking at the chart from the current 0.71200, we can expect a pullback up to 0.71500. Moving averages are from the top, and the pair made a break below all of them. The last one was below the MA200 today (purple line). We can look for better support first at 0.70600, and if we see a break and below, the pair can soon be found at 0.70000.

-
Support
-
Platform
-
Spread
-
Trading Instrument


