


NZD/USD forecast for December 21, 2020
Looking at the chart on the weekly time frame, technically, we have a resistance of 0.71000. Today’s decline in the New Zealand dollar can be linked to a global increase in risk worldwide with the emergence of a new virus in the UK. In such an atmosphere, investors enter more secure currencies such as USD, CHF, and JPY, and other currencies are in the background and left to themselves.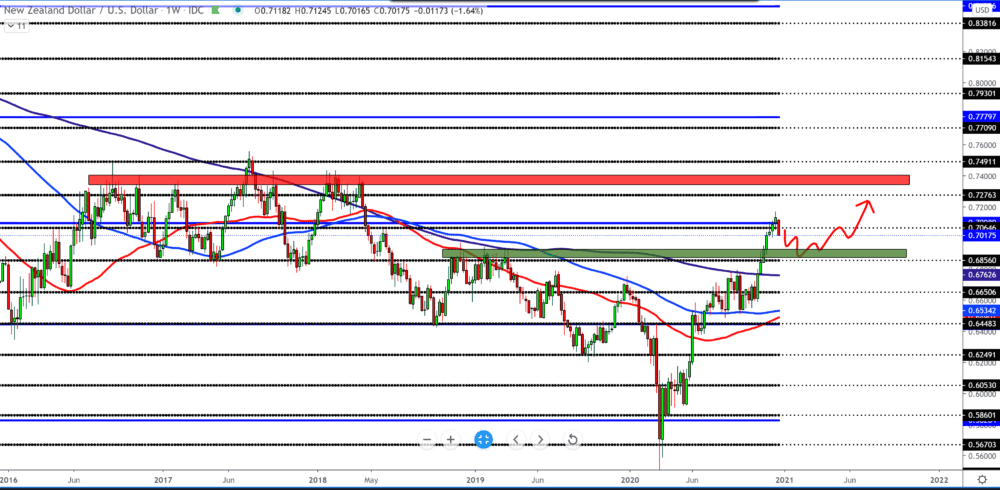
If the NZD/USD pair continues to fall as potential supports, we may be moving averages, the first MA200. Now the psychological support is 0.70000, and we can see the break below the next one is at 0.68500. This week’s first day brings bearish winds; best to wait another day or two for some better picture on the chart.
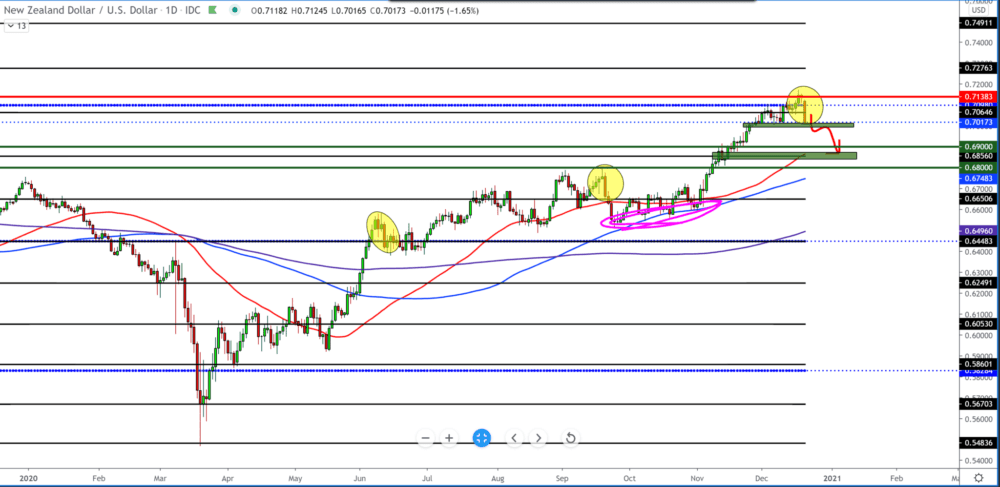
We see a strong daily bearish candlestick and a strong potential continuation falling due to a global increase in risk on the daily time frame. We must first wait to see how the NZD/USD pair will behave around 0.70000 and whether the support will last if we cannot expect the NZD to soon meet the moving MA50 average. In the short term, the New Zealand dollar is not doing well in the coming period.
On the four-hour chart, we see the break of the two moving averages MA50 and MA100, and now we see how the NZD/USD pair will behave with the encounter with MA200. We have a lot of support from the bottom, and we have to pay attention to that.
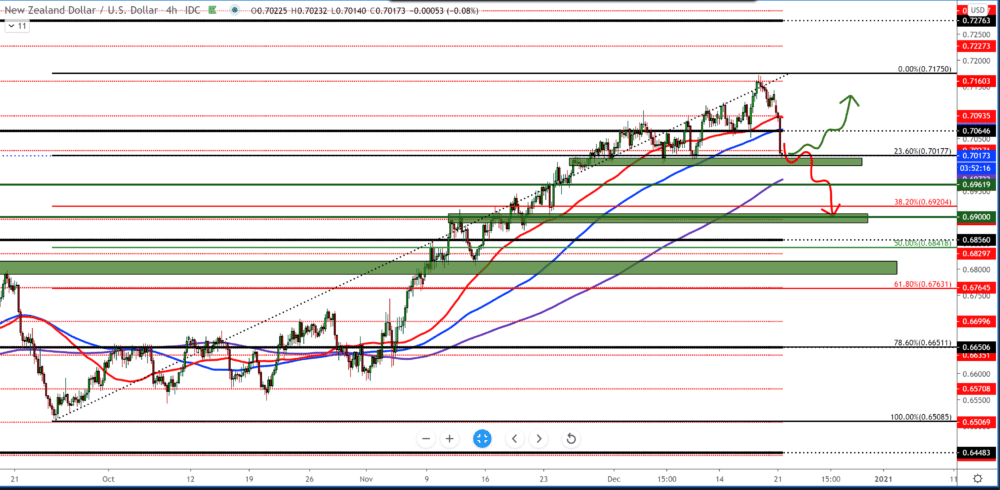
By setting the Fibonacci level, we go to the fact that it is currently at 23.6% and that if we see a break, we look at the next level at 38.2%. If the pair bounces off the Fibonacci level of 23.6% and moves up, we need to pair make a break above MA50 and MA100 as a confirmation for the continuation of the bullish scenario.
-
Support
-
Platform
-
Spread
-
Trading Instrument

