Hammer Pattern Stock – How to Trade It?
Are you interested in hammer candlestick patterns? Interestingly, they are one of the most utilized patterns in technical analysis.
What do you think of “hammer pattern stock?”
It is possible to use hammer candlestick patterns across various markets, including stocks, bonds, etc. Hammer candles have the ability to help price action traders identify potential reversals following bullish or bearish trends.
Depending on the context and timeframe, the above-mentioned patterns may suggest a bullish reversal at the end of a downtrend or a bearish reversal after an uptrend. Along with other technical indicators, hammer candles may give traders good entry points for long as well as short positions.
As stated earlier, the hammer candlestick pattern works well with various financial markets. Traders like to use hammer candlestick patterns in order to measure the probability of outcomes when looking at price movement.
Importantly, it is better to use them alongside other trading methods. For example, combined with fundamental analysis, it may provide insights into trading opportunities.
People who aren’t familiar with the hammer candlestick pattern may ask, “What is a hammer candlestick pattern?”
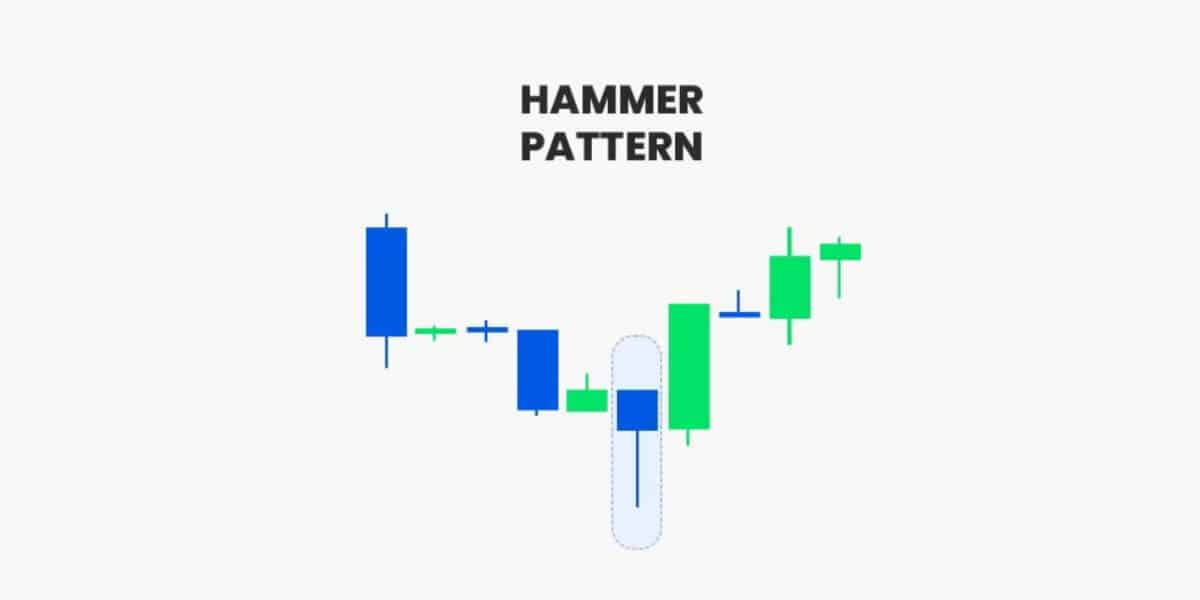
To make a long story short, a hammer candlestick is created when a candle shows a small body along with a long lower wick. It is desirable to remember that the wick (or shadow) should be considerably larger that the candle body.
Importantly, the long lower shadow indicates that sellers pushed the price down before buyers pushed it back up above the open price.
Advantages and disadvantages of the hammer candlestick patterns
Every candlestick pattern has its advantages and disadvantages. So, it is important to learn more about various patterns.
It is better to use the hammer candlestick chart patterns alongside other trading strategies, such as trendlines, moving averages, relative strength index (RSI), moving average
convergence/divergence (MACD), as well as Fibonacci.
Let’s get back to the advantages and disadvantages of the hammer candlestick patterns. We can start with the advantages.
It is possible to use the hammer candlestick pattern in order to identify trend reversals in any financial market.
Besides, traders have the opportunity to use hammer patterns in multiple timeframes, making hammer patterns useful in both swing trading and day trading.
What about the disadvantages?
We need to mention that the hammer candlestick patterns rely on context. Unfortunately,
there is no guarantee that the trend reversals will occur.
Traders shouldn’t rely only on hammer candlestick patterns. It is better to combine the hammer candlestick patterns with other strategies as well as tools in order to increase the chance of success.
What is the difference between a hammer candlestick and Doji?
Dojis are similar to hammers. We need to note that a Doji candlestick opens and closes at the same price.
A hammer candlestick suggests a potential price reversal. But what about Doji? It usually suggests consolidation.
Interestingly, it may also suggest continuation or market indecision. In the vast majority of cases, Doji candles are neutral patterns. However, Doji candles can herald bullish or bearish trends in certain situations.
What is a trendline?
As you already know, it is better to use the hammer candlestick chart patterns alongside other trading strategies, such as trendlines.
But what is a trendline? Let’s find out!
To make a long story short, trendlines are easily recognizable lines. Traders draw trendlines on charts in order to connect a series of prices together. Notably, the resulting line is then utilized in order to give the trader a good idea of the direction in which an investment’s value might move.
People who are unfamiliar with trendlines might ask, “What do trendlines tell us?”
Technical analysts like to use it. Without exaggeration, it is one of the most important tools used by analysts. Interestingly, instead of looking at the past business performance or other fundamentals, analysts search for trends in price action.
Thanks to a trendline, it is easier to determine the current direction of market prices. According to technical analysts, the trend is your friend.
Do you know what to answer if someone asks, “Who uses trendlines?”
You may say, technical, financial analysts. Nevertheless, any investor can use trendlines.
Moving averages

Let’s discuss moving averages.
First of all, what is a moving average?
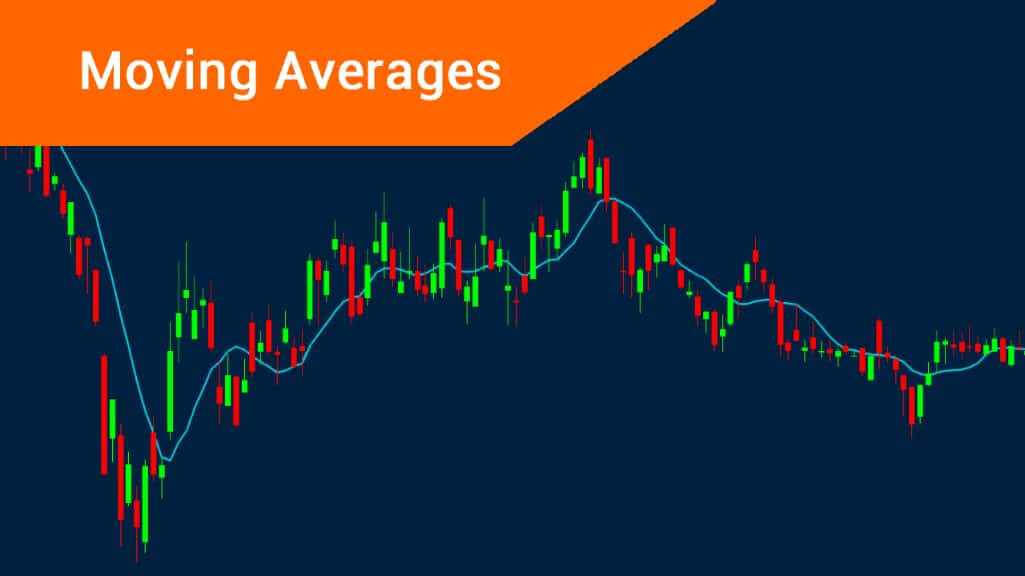
It is a technical indicator. Market analysts, as well as investors, may use a moving average in order to determine the direction of a trend.
Analysts utilize the above-mentioned indicator in order to check support and resistance by assessing the movements of an asset’s price.
Now, we can move on to the types of moving averages.
There are two basic forms of moving averages. The first one is the simple moving average (SMA), and the second one is the exponential moving average (EMA.)
Let’s first take a look at the simple moving average.
It is a straightforward technical indicator. The indicator mentioned earlier is obtained by summing the recent data points in a given set and dividing the total by the number of time periods.
It is worth noting that traders use the above-mentioned indicator in order to generate signals on when to enter or exit a market. The simple moving average is backward-looking, as SMA relies on past price data for a given period.
Analysts and investors used the indicator mentioned earlier in order to determine buy and sell signals for securities. Thanks to SMA, it is easier to locate support and resistance prices in order to obtain signals on where to enter or exit a trade.
As stated earlier, there are two basic forms of moving averages. We have already discussed the first type. So, let’s discuss the second type.
As a reminder, the second one is the exponential moving average (EMA). It gives more weight to the most recent price points in order to make it more responsive to recent data points. It is more responsive to recent price changes than the simple moving average.
What is the difference between an exponential moving average and a simple moving average?
Do you know what the main difference between the above-mentioned technical indicators is?
The main difference between them is the sensitivity that the exponential moving average and simple moving average place on price changes. The SMA is more sensitive to recent price point changes, while the EMA is more responsive to the latest price changes.
It is quite hard to calculate the EMA; however, the vast majority of charting tools make it easy for traders to follow the above-mentioned indicator. What about SMA? On the contrary, it is quite easy to calculate SMA.
Don’t forget to gather more information about hammer pattern stock.
Risk management

First and foremost, there is no way to avoid risk in trading. However, it is possible to reduce risk.
Traders have the opportunity to select from various strategies.
Hopefully, it is possible to reduce the risk. Let’s take a look at various strategies.
Are you interested in the stock market? Feel free to learn more about hammer pattern stock.
One option is to follow the trend of the market.
However, the problem is that it is quite hard to identify trends in the market. Moreover, trends come and go very fast. For example, a market trend may last a single day.
However, it may last a month or several months or longer. Importantly, short-term trends operate within long-term trends.
Diversification
Another option is to diversify your portfolio. It makes to create a well-diversified portfolio in order to minimize the risk. For example, you can diversify your portfolio by investing in several companies, sectors, as well as asset classes.
It is vital to start reading about various companies, big and small. Moreover, it is a good idea to watch videos about tech giants and other popular companies. To cut a long story short, it is better to create a well-diversified portfolio.
You should also control your emotions and not vice versa. Unfortunately, many traders aren’t able to control their emotions. Without a doubt, managing emotions is the most difficult part of trading.
A proper risk-management strategy is absolutely necessary in order to protect traders from catastrophic losses. You need to determine your risk tolerance. Moreover, it is important to protect yourself from a long-tail risk or black swan event.
We should also mention one very important detail that is directly related to risk management. You need to use stop loss in order to minimize the risk.
It is a type of order that investors or traders use in order to minimize their potential losses in the stock market.


