


Gold and Silver: Week Maximum
- Today’s gold price formed its weekly maximum at the $1675 level.
- The price of silver is stable today, maintaining the gains from yesterday.
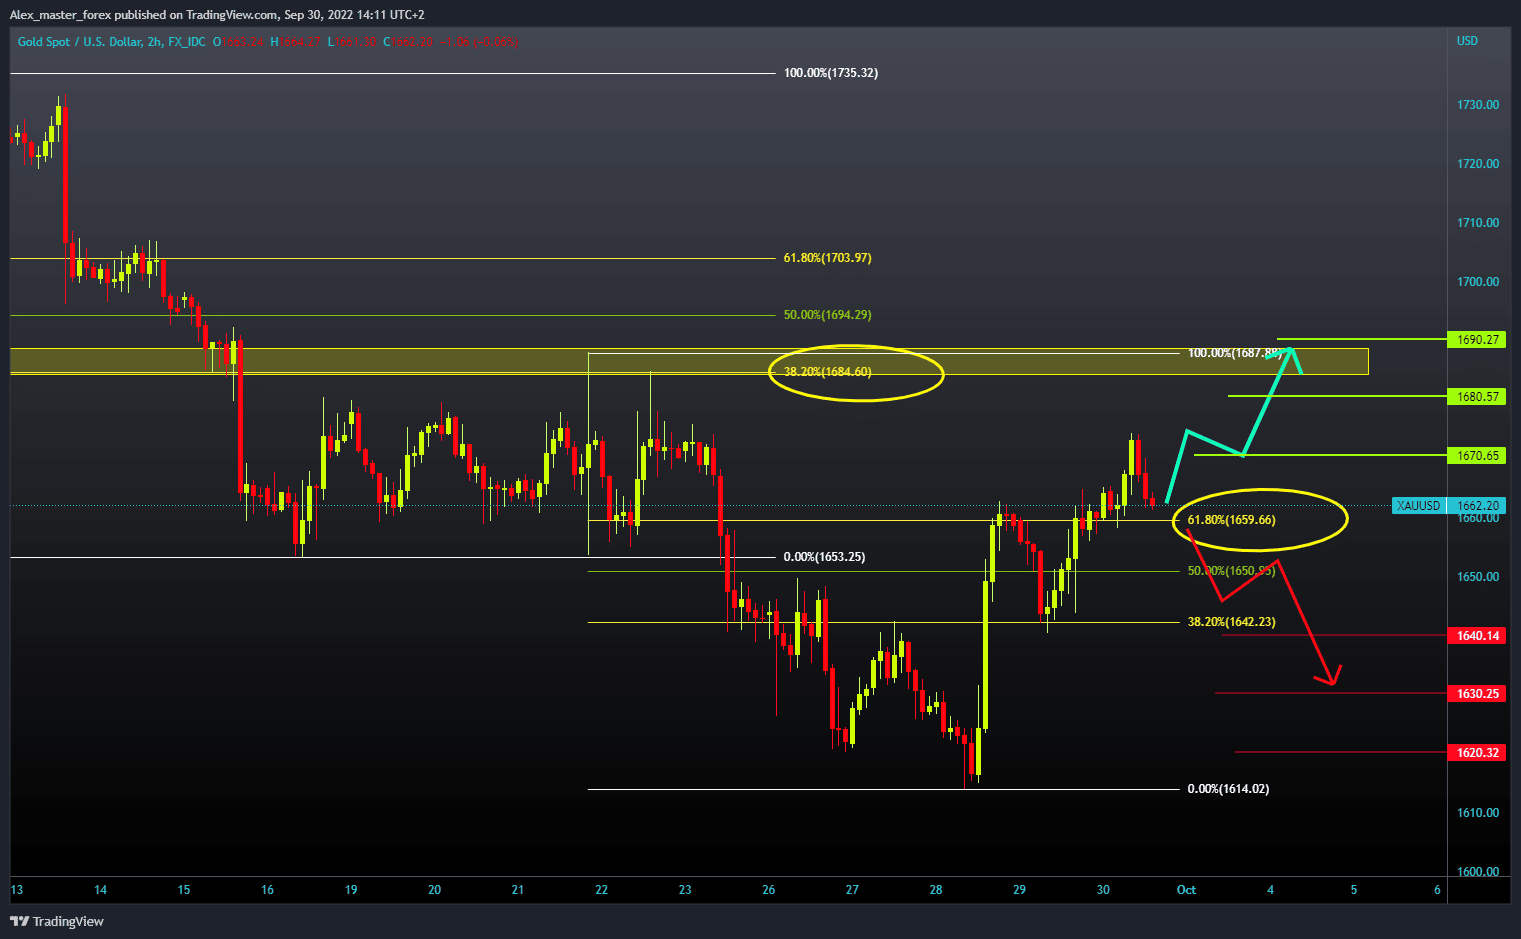
Gold chart analysis
Today’s gold price formed its weekly maximum at the $1675 level. Now we see a pullback to $1660, where we will try to find support and start a new bullish impulse towards the $1680 level. Potential higher targets are $1690 and $1700 levels. For the bearish option, we need a continuation of this negative consolidation and a drop in the price of gold below 61.8% Fibonacci i.e., $1660. After that, the first next target is the 50.0% Fibonacci at the $1650 level. If we are not able to maintain at that level, the continuation of the fall could take place until the previous low at 38.2% Fibonacci at $1640. A further strengthening of the dollar index would affect a further drop in the price of gold, and the potential lower targets are the $1630 and $1620 levels.
Silver chart analysis
The price of silver is stable today, maintaining the gains from yesterday. Today’s maximum is at the $19.20 level, and now I’m trying to stay in the zone around the $19.00 level so we can continue with the recovery with the next bullish impulse. Today’s resistance coincides with the 61.8% Fibonacci. We need a silver price break above for a bullish option. Then we need to hold ourselves above. And after that, we need a positive consolidation to move towards the upper trend line and the $19.50 level. For a bearish option, we need a negative consolidation and a price drop to $18.75 at $38.2 Fibonacci. A price breakout below could first take us down to $18.50, the previous low. A potential lower target is the $18.00 level.

Market Overview
Upbeat US data and hawkish central banks are likely to keep metal prices low.

