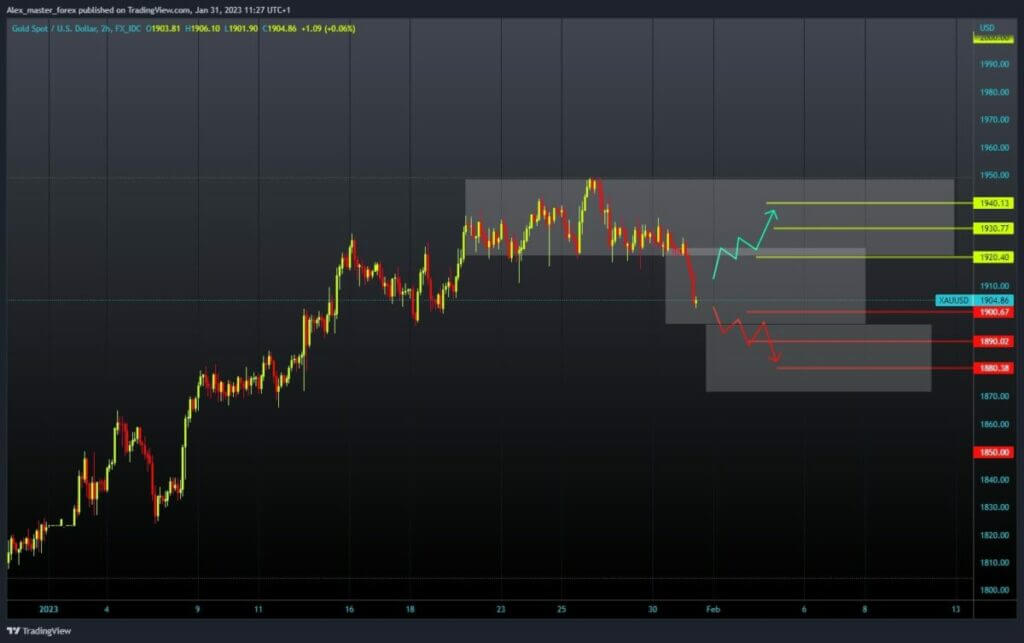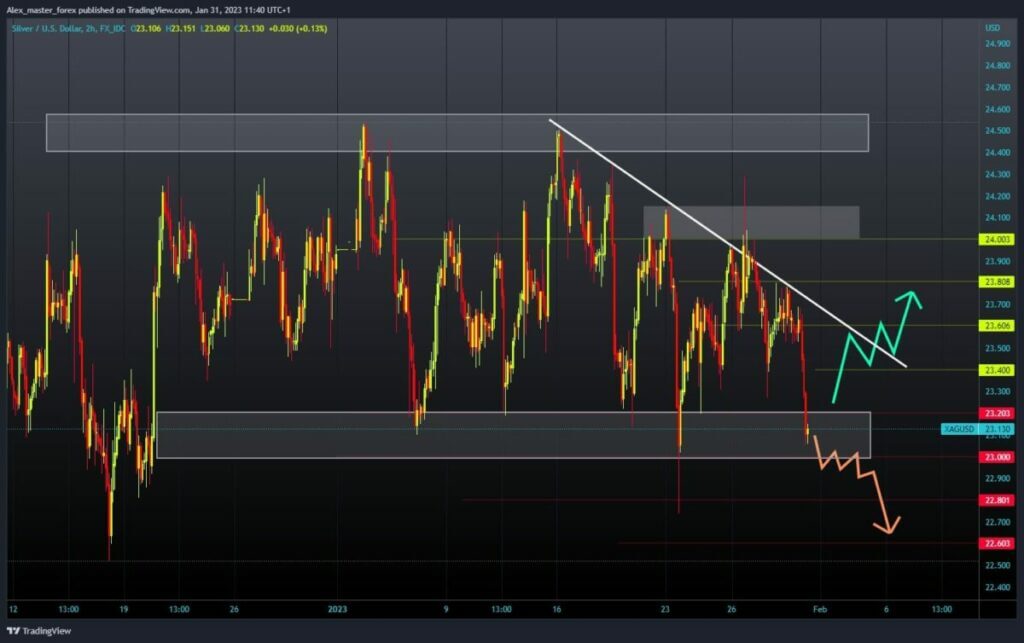
Gold and Silver: The gold is testing support at $1900
- During the Asian trading session, the price of gold fell from the $1920 level.
- During the Asian trading session, the price of silver made a downward turn and broke the support at the $23.60 level.
Gold chart analysis
During the Asian trading session, the price of gold fell from the $1920 level. For now, the price finds its support at the $1900 level. The last time we were at that level was on January 19. If a breakout below occurs, we could expect a potential further move above the gold price to lower support levels. For a bullish option, we need a positive consolidation and a return to $1920 from the previous consolidation.
Then we need to climb above and try to stay up there. With the new bullish impulse, we could expect to see a continued recovery in the price of gold. Potential higher targets are the $1930 and $1940 levels.

Silver chart analysis
During the Asian trading session, the price of silver made a downward turn and broke the support at the $23.60 level. The price fell to the $23.00-$23.20 support zone and is now inside that zone. It could happen that we get support here and start a new bullish impulse. We need to get back above the $23.80 level to say that the price could continue on the bullish side and find itself above the $24.00 level again.
We need a negative consolidation and a drop below the $23.00 level for a bearish option. Such a move could lead to a further decline in the price of silver. Potential lower targets are the $22.80 and $22.60 levels.


