


Gold and Silver: strong bullish trend
- During the Asian session, the price of gold rose to 1864.20 dollars.
- during the Asian session, the price of silver was in a strong bullish trend but stopped at the $ 22.32 level.
- After four consecutive weeks of declining gold ETFs followed by Bloomberg, just under four tones of inflows were re-registered last week.
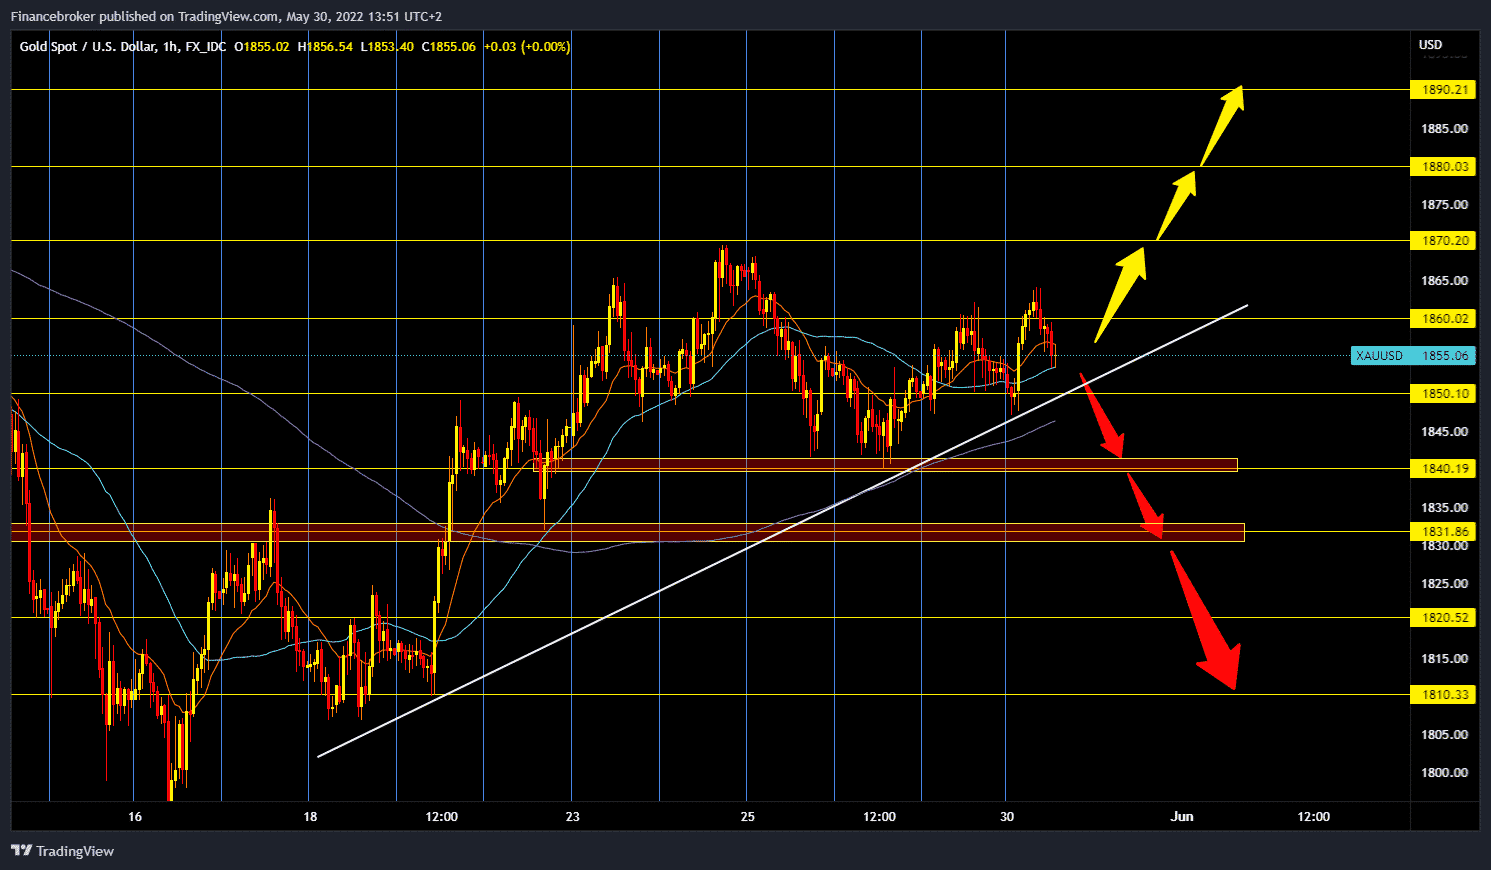
Gold chart analysis
During the Asian session, the price of gold rose to 1864.20 dollars. There she encountered resistance, and after that, we see the current pullback to the $ 1853.00 price. The dollar has been stable in the zone of around 101.40 for the last few hours, making gold traders nervous and therefore giving up on new buy options. The price is approaching last week’s trend line, and if it provides us with appropriate support, then we can expect the bullish trend to continue.
We need a new test of last week’s high at the $ 1870 level to continue the bullish option. Break prices above 1870 could make the jump to $ 1880 and $ 1890 levels. We need a continuation of today’s negative consolidation for the bearish option. Price would have to break below the support line and $ 1850 level. After that, the price would probably fall to the previous low of $ 1840. Potential following levels of support are $ 1830, $ 1820 and $ 1810, last week’s minimum.
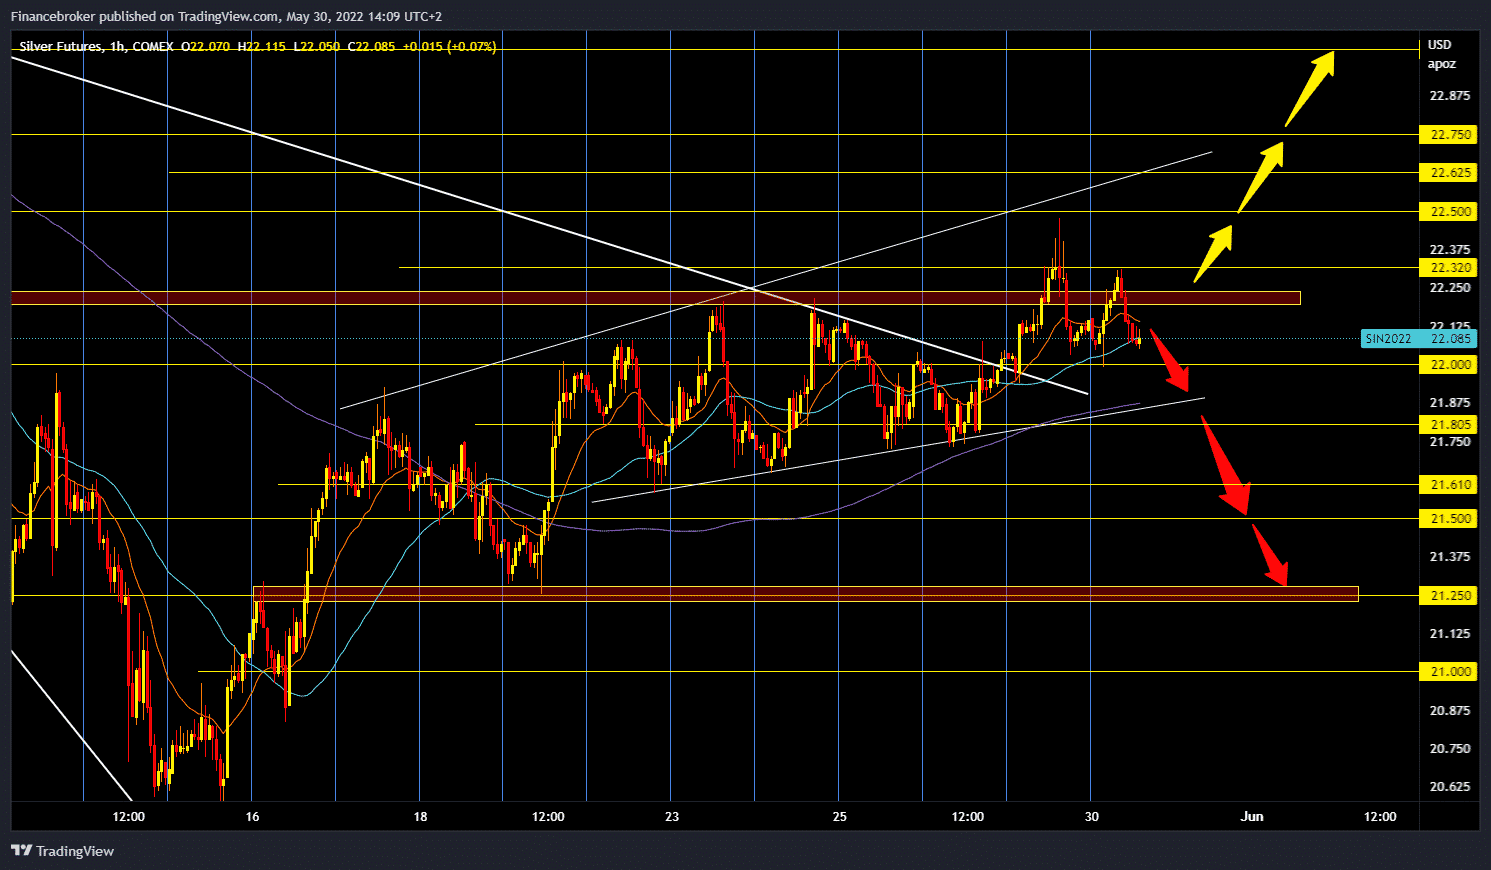
Silver chart analysis
during the Asian session, the price of silver was in a strong bullish trend but stopped at the $ 22.32 level. As the European session began, the price of silver began to recede, finding support in the zone of around $ 22.00. It is now probable that the pullback will continue until the $ 21.80 price and support on the lower trend line. Breaking prices below that support would increase bearish pressure on traders to sell silver and thus lower its price. Potential bearish targets are $ 21.60, $ 21.50 and $ 21.25 level. For the bullish option, we need a new positive consolidation and price growth first above the $ 22.32 level. After that, we will try to test last week’s high again at the $ 22.50 level. Potential next above $ 22.50 bullish targets are $ 22.62, then $ 22.75.
Market overview
After four consecutive weeks of declining gold ETFs followed by Bloomberg, just under four tones of inflows were re-registered last week. Speculative financial investors have also looked more open to gold recently, expanding their net long positions by 40% to 61,000 contracts in the previous week, according to CFTC statistics. If this turns out to be more than just current demand, gold is likely to be given an extra boost to rising prices. ”
Gold should continue to be sought as a means of storing value. The data on inflation in the Eurozone, which will be published tomorrow, will probably show a renewed increase in the inflation rate to a record high level.

