Gold and Silver: Gold’s Price Face Resistance
- The price of gold is starting to lose the momentum of the bullish trend, and we are now seeing the first price pullbacks.
- Yesterday’s silver price recovery stopped at the $22.00 level.
Gold chart analysis
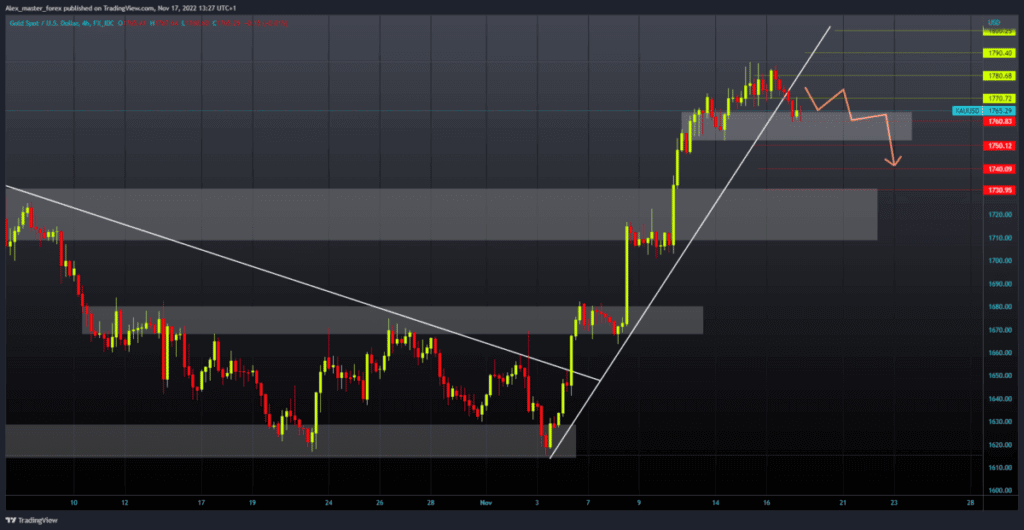
The price of gold is starting to lose the momentum of the bullish trend, and we are now seeing the first price pullbacks. During the Asian trading session, the price of gold retreated below the $1770 level. It found support at $1,760, and for now, it manages to stay above despite the visible pressure. For a bearish option, we need the price to break below and then stay below. Then, we would likely see further negative consolidation and a further retreat in the price of gold.
Potential lower targets are $1750 and $1740 levels. For a bullish option, we need a positive consolidation and a return above the $1770 level. That would put us in a better position to start a recovery and reach this week’s high at the $1786 level. Potential higher targets are the $1790 and $1800 levels.

Silver chart analysis
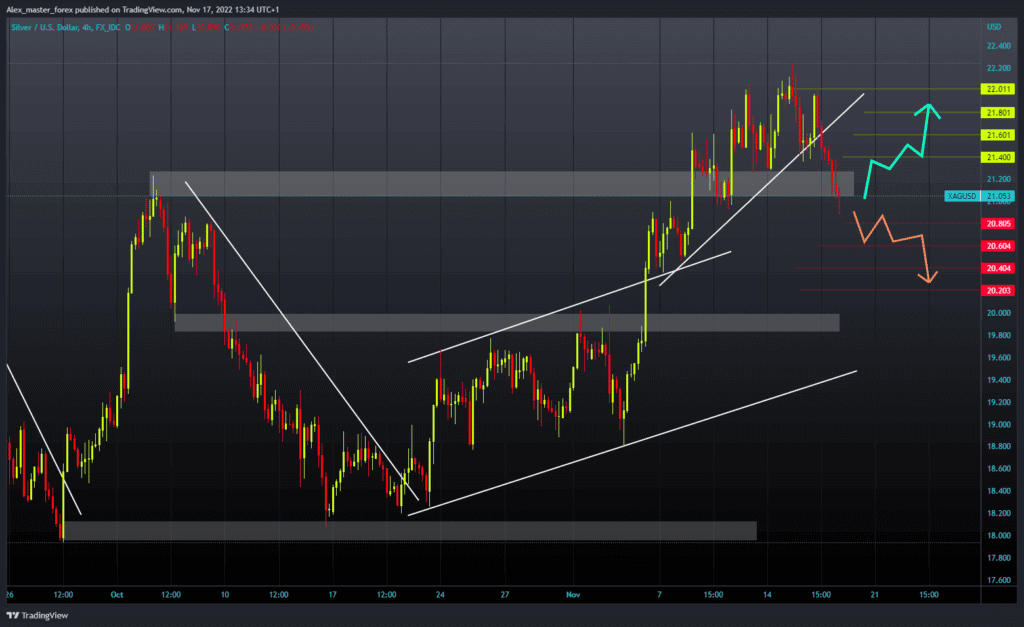
Yesterday’s silver price recovery stopped at the $22.00 level. After that, we see a strong bearish impulse and a price drop until the end of the day to the $21.60 level. During the Asian trading session, the price of silver continues to retreat, falling below the $21.00 level in the European session. Today’s low was the $20.88 level.
We are hovering around the $21.00 level, but the bearish pressure is increasing, and we could expect a continuation of the price pullback. Potential lower targets are the $20.80 and $20.60 levels. For a bullish option, we need a new positive consolidation and a return above the $21.40 level. This would form a new bottom from which a new bullish impulse could occur. And the potential higher targets after that are the $21.60, $21.80, and $22.00 levels.


