Gold and Silver: Gold meets resistance at $1760
- The price of gold encountered resistance at the $1760 level during the Asian trading session.
- This week’s silver price growth stopped yesterday at the $21.67 level.
Gold chart analysis
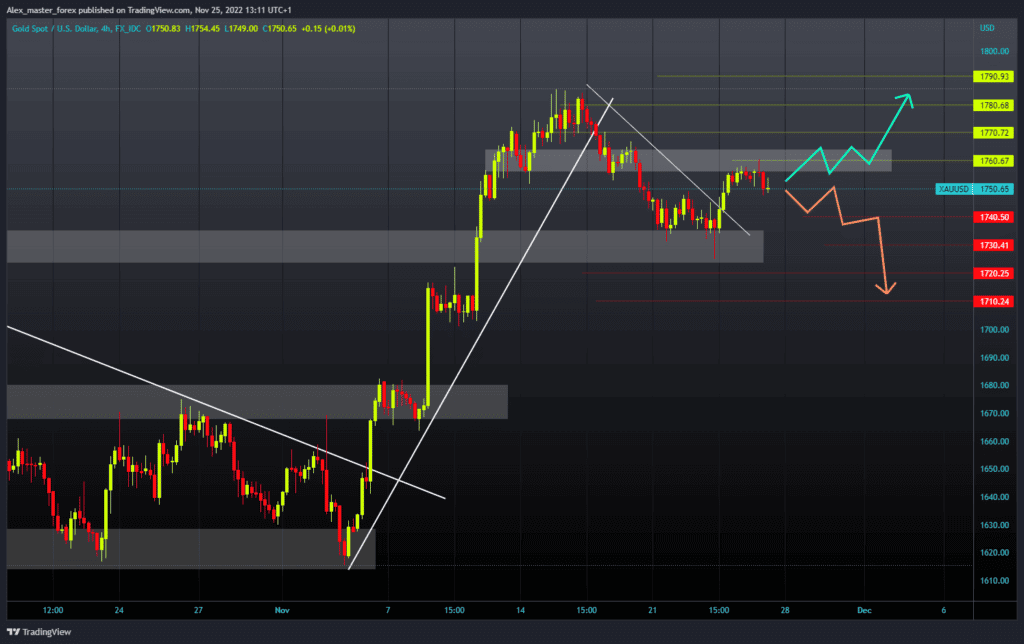
The price of gold encountered resistance at the $1760 level during the Asian trading session. Since then, we have been in a minor pullback to the $1750 level. The price of gold could be found again in the previous support zone of $1730-1740. A break below would be a sign for us that the price of gold could continue to fall. Potential lower targets are the $1720 and $1710 levels.
For a bullish option, we need a positive consolidation and a return above the $1760 level. Then it is necessary to maintain up there and continue the recovery with a new bullish impulse. Potential higher targets are $1770 and $1780 levels.

Silver chart analysis
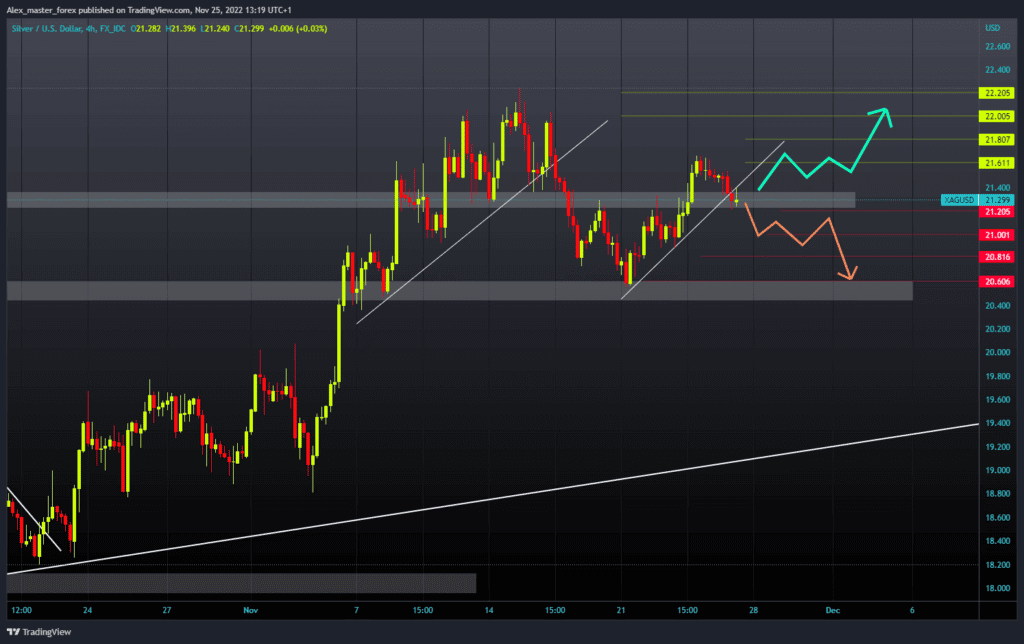
This week’s silver price growth stopped yesterday at the $21.67 level. Since then, the price has been in retreat during the Asian session and continued in the European session as well. We are currently testing support at the $21.20 level. For a bearish option, we need negative consolidation and a break below the current support level.
After that, we would probably go down to the $21.00 level. If we fail to find support there, we will return to this week’s low from the beginning of the week at the $20.60 level. For a bullish option, we need a new positive consolidation and price return to the $21.60 resistance level. A break above would be very helpful for us to continue the bullish option. Potential higher targets are the $21.80 and $22.00 levels.


