Gold and Silver: Gold is at $1,940 before of Fed’s news
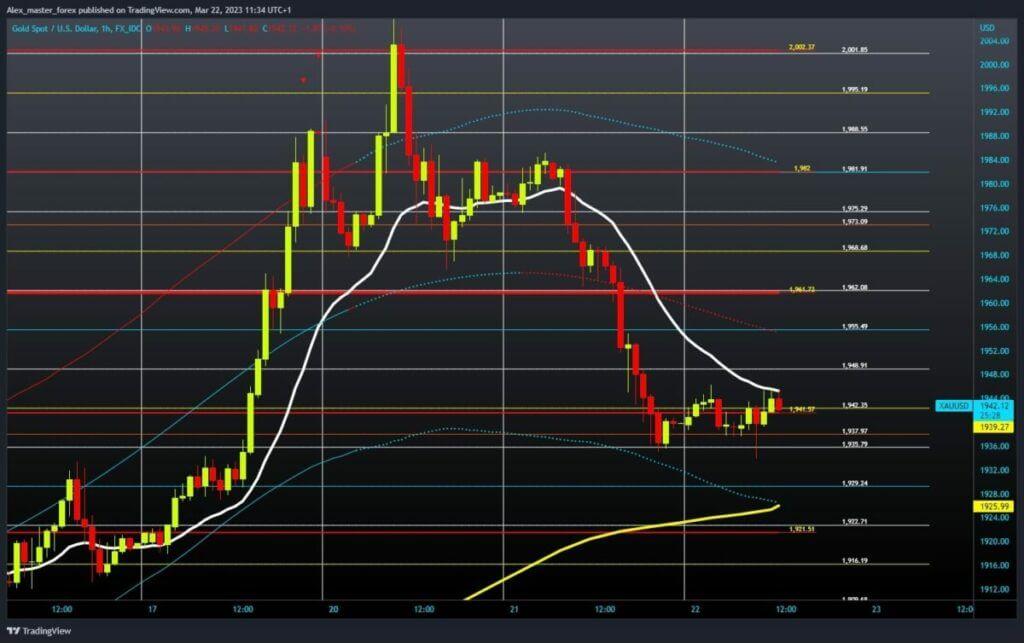
- During the Asian trading session, the price of gold dropped to the $1934 level.
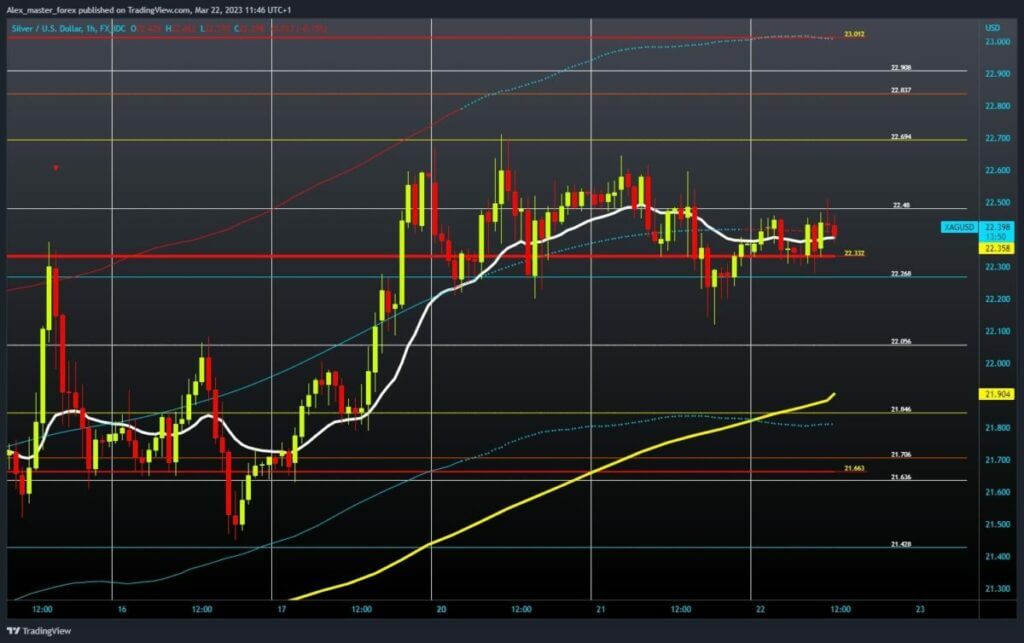
- During the Asian trading session, the price of silver moved slightly above the $22.33 level.
Gold chart analysis
During the Asian trading session, the price of gold dropped to the $1934 level. After that, we see a recovery and a return above the $1940 level. At the $1945 level, we have resistance in the EMA 20 moving average, and we need a break above it for further continuation to the bullish side. Potential higher targets are $1948, $1955, and $1962.
We need a negative consolidation and pullback below the $1935 level for a bearish option. After which, we could expect to see a continuation of the pullback in the price of gold. Potential lower targets are the $1929 and $1922 levels.

Silver chart analysis
During the Asian trading session, the price of silver moved slightly above the $22.33 level. This could be a good support zone from which a new bullish impulse and rise in the price of silver could be generated. We need to move above the $22.48 level and try to hold above there.
After that, we could see a continuation of the price growth up to the $22.69 level. Potential higher targets are the $22.83 and $22.90 levels. We need a negative consolidation and a price drop below the $22.26 level for a bearish option. After such a move, we could expect the price to drop to $22.05.


