


GBP/USD analysis for April 14, 2021
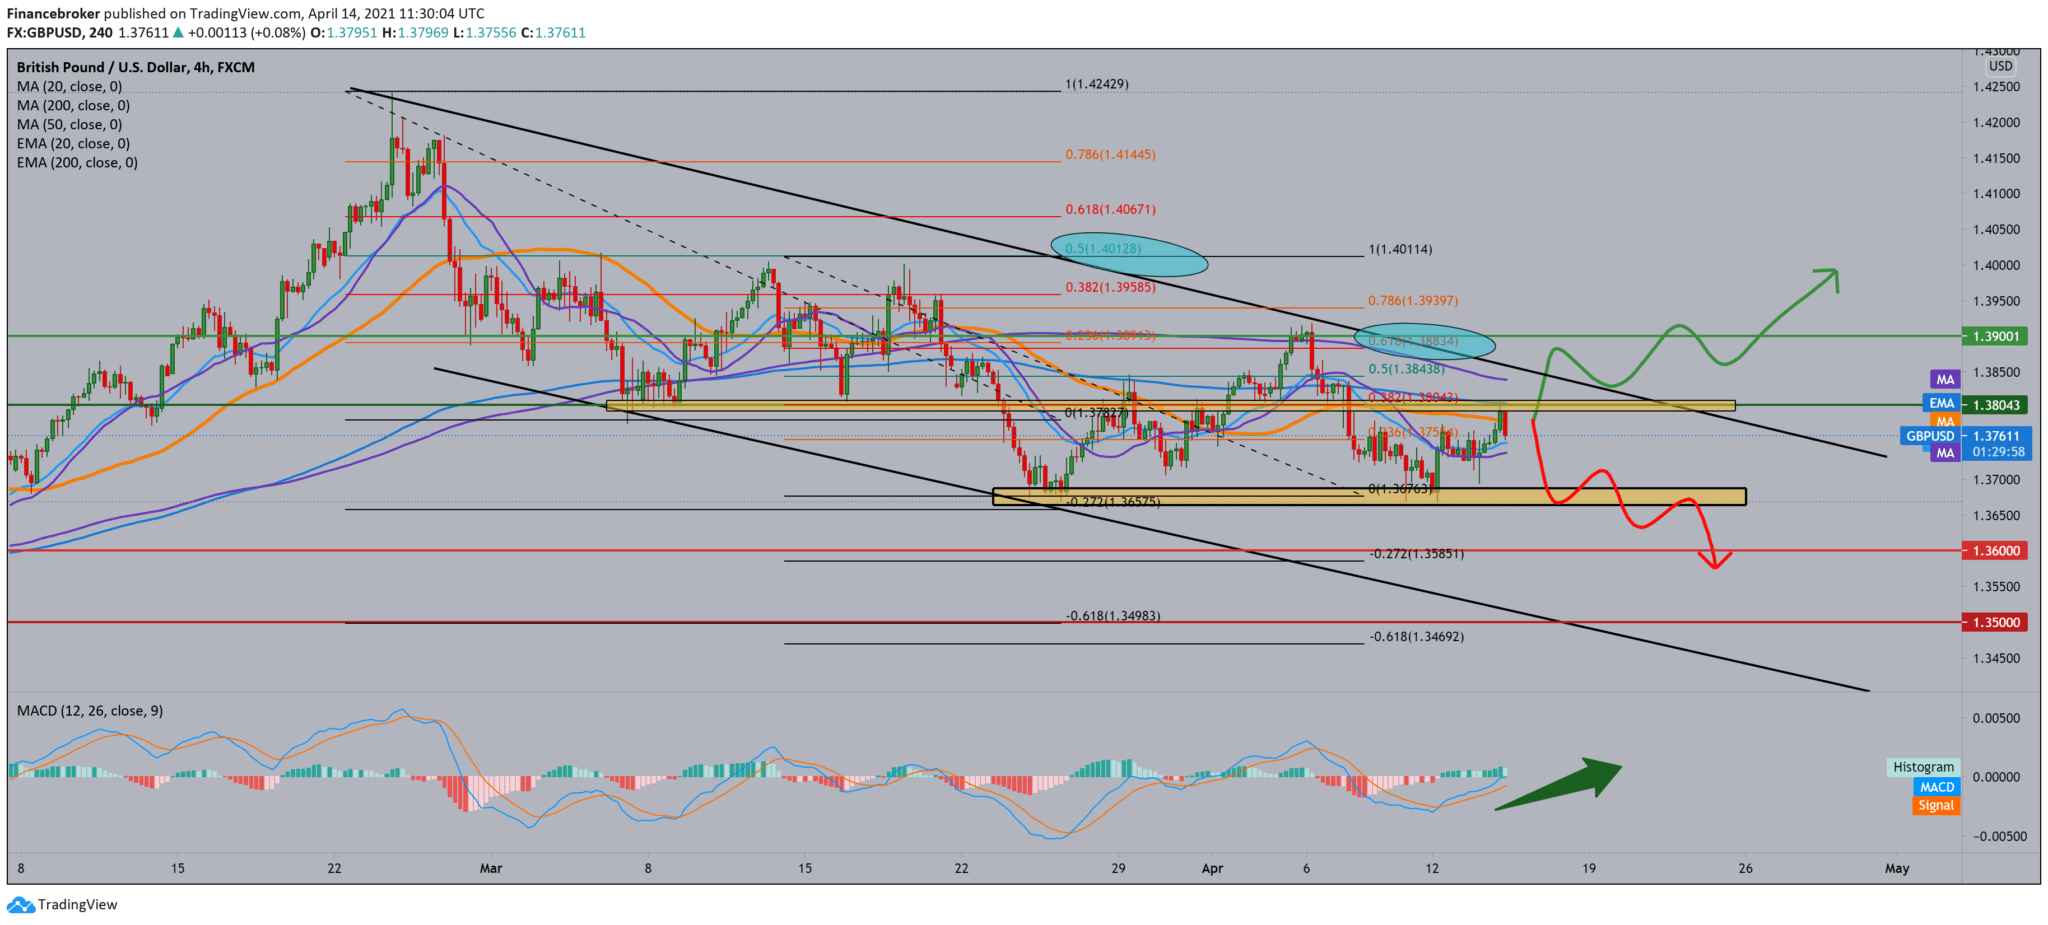
Looking at the graph on the four-hour time frame, we see that the GBP/USD pair is moving in a descending channel, with a certain pullback to the top line of the channel. The GBP/USD pair are currently testing the EMA200 moving average and a zone of around 1.38000. If the Pound continues to show its weakness, we can expect a further withdrawal to 1.37000, and if we see a further decline, we will drop to 1.36000. We first need a break above the upper trend line for the bullish scenario and consolidation above 1.39000. Looking at the MACD indicator, we are in a bullish trend focusing on the rear candlestick, which is very bearish. So the bullish signal is weakened, and a short pullback can occur.
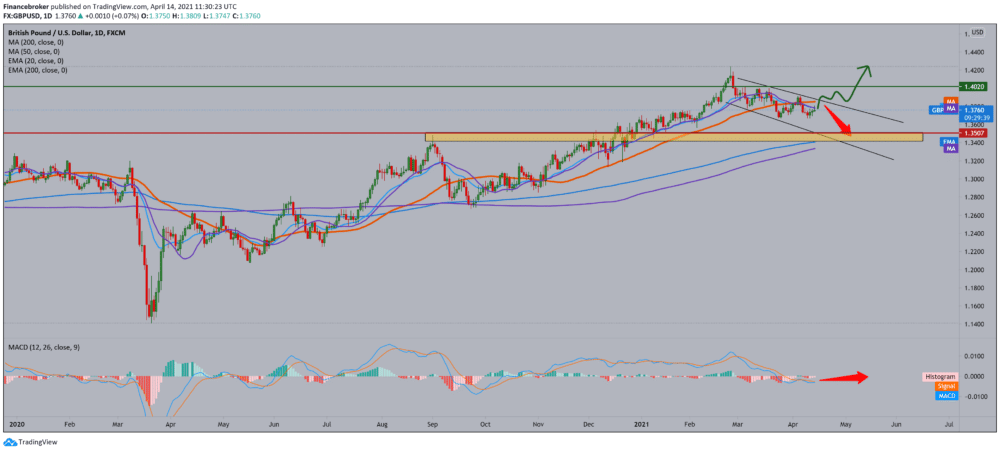
On the daily time frame, we see the GBP/USD pair under the pressure of starting averages MA20, EMA20, and MA50 with a tendency to lower the price to even lower levels with even greater pressure. Based on that, our target is MA200 and EMA200, and the zone on the psychological level is 1.35000. We are moving within the falling channel, which we can expect in the coming period. The MACD indicator is in the middle and slightly bullish, but the bullish signal is not so clear yet.
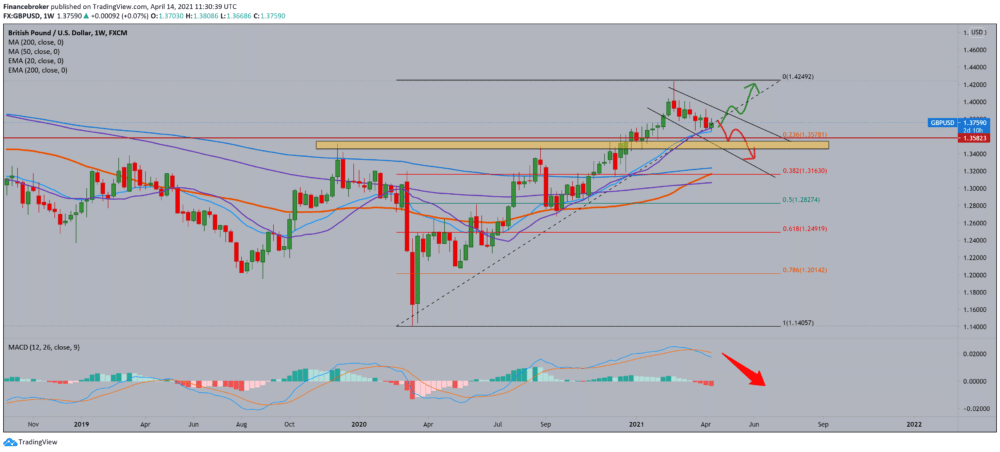
On the weekly time frame, we see that the GBP/USD pair is testing MA20 and EMA20 and that they can find potential support for the continuation of the bullish trend. If we see a break below those two moving averages and 23.6% Fibonacci levels, the GBP/USD pair will fall to MA200 and EMA200 close to 38.2% Fibonacci levels. The MACD indicator is purely bearish and based on it, and we go further down. There are no signs of slowing down, although the Sunday candle is not yet closed, and we have two more days, and anything is possible.
-
Support
-
Platform
-
Spread
-
Trading Instrument

