


Forecasts for seven currency pairs for 2021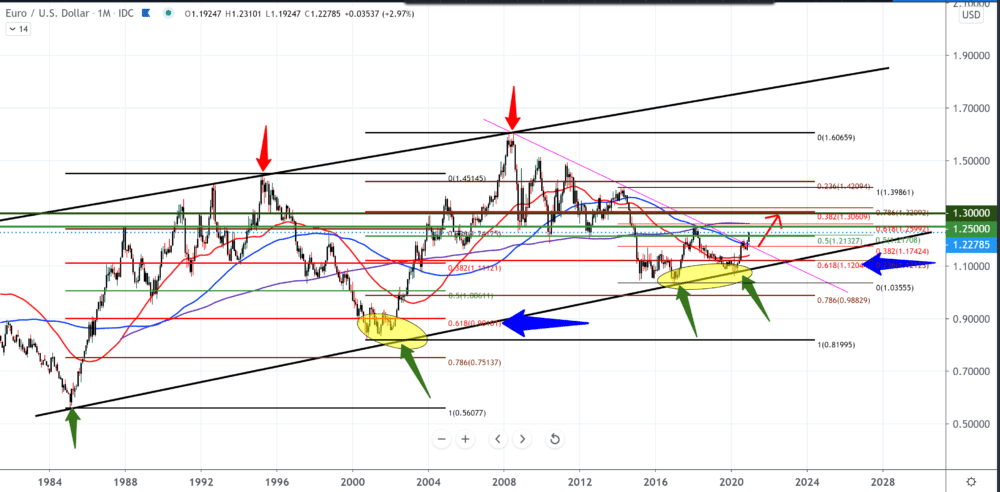
Our first pair is EUR/USD chart on a monthly time frame. The movement occurs in one large channel where we see the pair bouncing between the lower support line and the upper resistance line. By setting the Fibonacci level, we see a repetition of the pullback rejection site to a zone between 61.8% and 78.6%. Looking at the chart in this way, the bullish trend is waiting for us in 2021 as well. Our first serious target is 1.25000, and the potential resistance is MA200 (purple line). If the EUR / USD moves as in previous cycles, and the dollar continues to weaken, we can see this pair again at 1.30000.
GBP/USD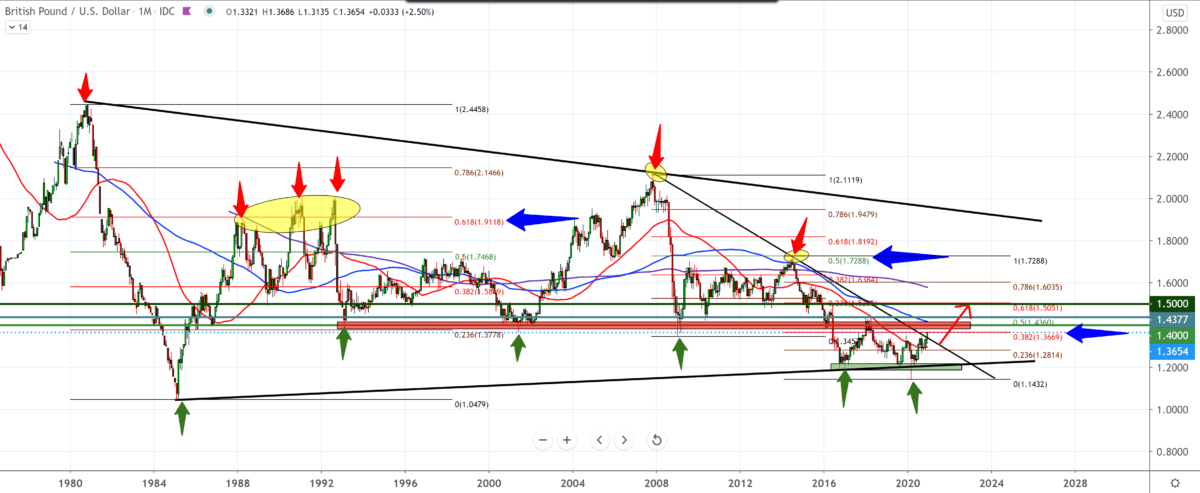
Looking at the GBP/USD pair on a monthly time frame, we see that there is now an excellent chance for the pound to continue to higher levels next year and take advantage of the dollar’s weaknesses, and with the help of the Brexit agreement, strengthens the pound. Technically from the bottom, we have trend line support and break above the moving average of MA50. As the new year’s first target, our zone is around 1.40000 up to 1.43700, the previous high from 2018. If everything goes well for the foot target of 1.5000 is also possible because the bullish trend is only in the first third.
USD/JPY
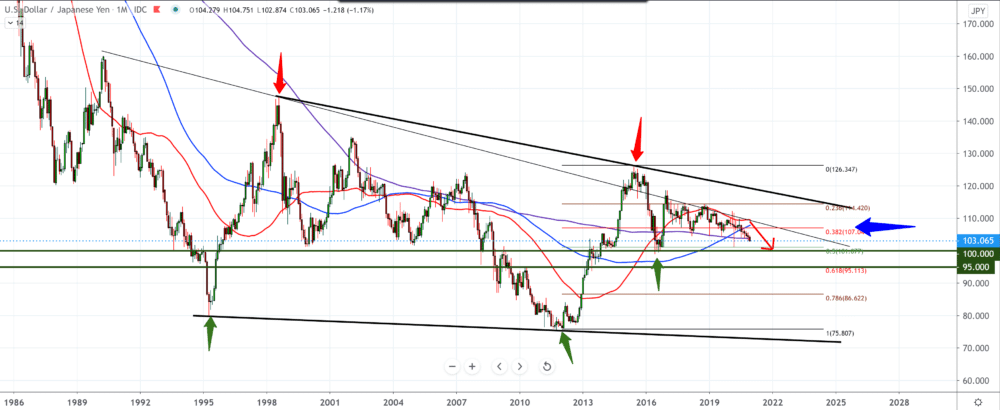
Looking at the USD/JPY pair on a monthly time frame, we see a long-term downward trend since 2015. We see the movement inside the falling channel with the pressure of the moving averages from the top, and it is currently testing the MA200 (purple line). The continuation of the bearish trend is very likely to the psychological zone at 100.00. Just above that, our Fibonacci level is 50.0% at 101.00. The previous higher low is at 99.00, a critical level for this pair. A weak dollar is still expected in the coming period, and other currencies will use it to their advantage.
EUR/AUD
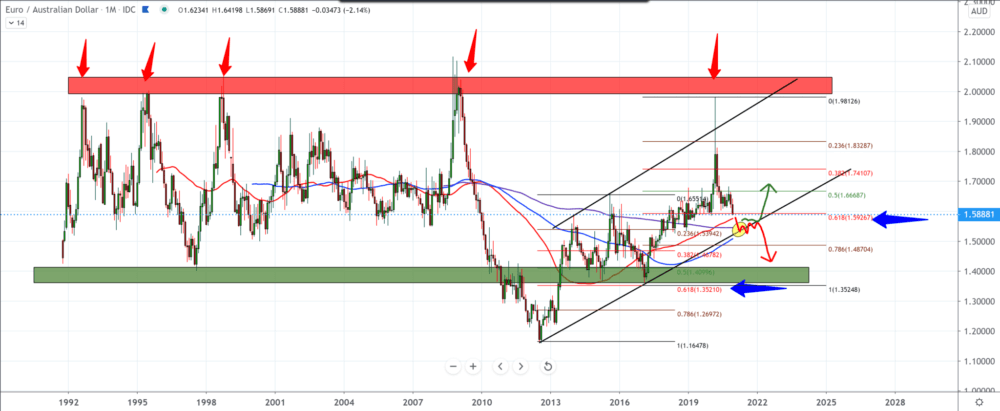
The chart on the monthly time frame tells us that the EUR/AUD pair has been in a bullish trend since 2012, but this year has not been a benevolent euro against the Australian dollar. Here we can expect the pair to fall still, making a break with the first moving average of MA50 (red line). By setting the Fibonacci, we see the first pullback rejection at 61.8%, now the pair is testing the second pullback again at 61.8%, but we can expect the pair to still test the bottom trend line as better technical support, along with MA100 (blue line) and MA200 (purple line).
GBP/CAD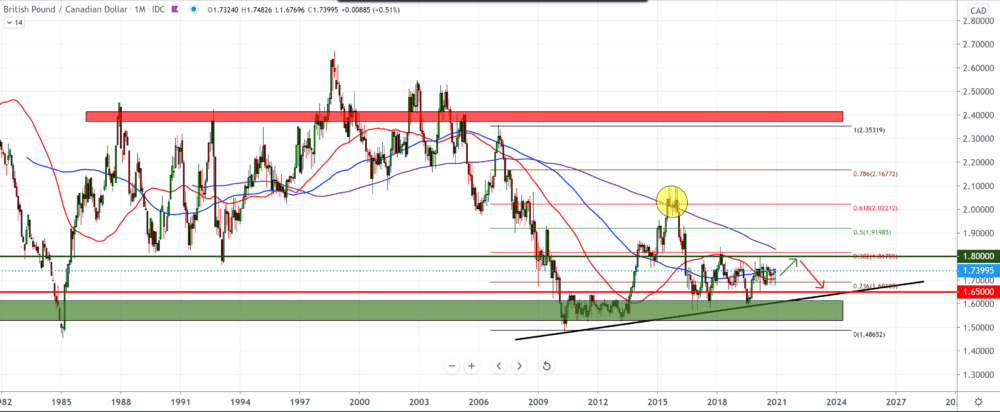
Looking at the GBP/CAD pair on the monthly time frame, we see from below one trend line from 2010 supporting the pound against the Canadian dollar. Technically, the pair is most likely to reach the zone at 1.8000, where it will later face high resistance, moving average MA200 (purple line) and Fibonacci level 38.2%. Our trading zone for this pair is from 1.65000-1.80000. The price of oil has a big impact on the Canadian dollar and the global economy, whose oil is the driving force. The current instability in the world around Coronavirus and its impact on the economy is not yet over with the emergence of a new virus.
AUD/NZD
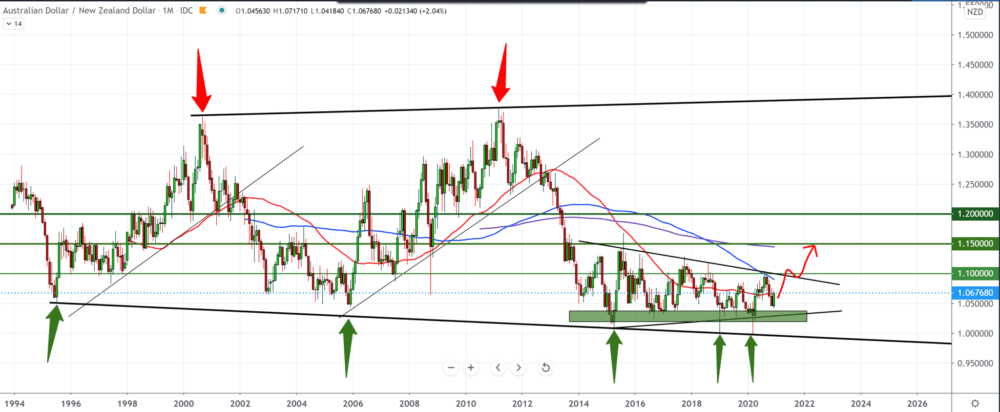
Looking at the chart on the monthly time frame, we see one big channel in which the AUD/NZD pair moves. Since 2015, the pair has been moving sideways above the canal’s bottom line, making consolidation. Here we can expect the pair to move to the bull’s side when it comes out of consolidation. Our target for the bullish scenario is 1.10000, but we first need a break above the moving average MA100 (blue line). The Australian and New Zealand economies are closely linked and interdependent. The one who recovers faster to the effects of the coronavirus will have the advantage.
CHF/JPY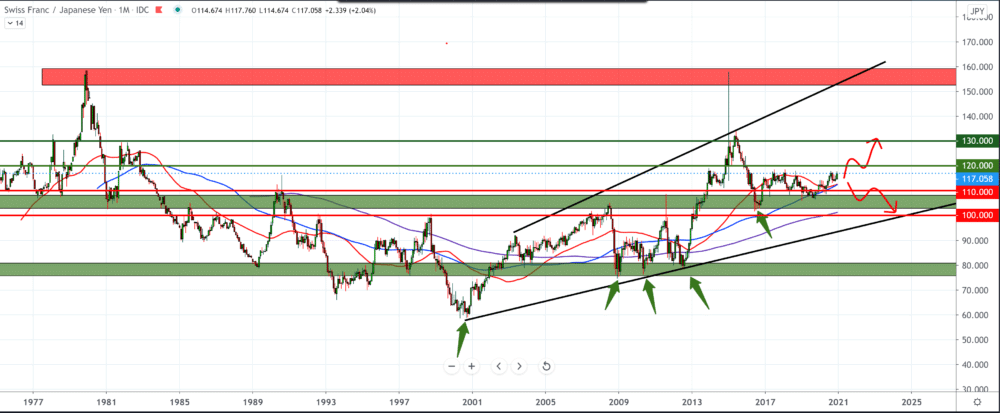
Looking at the CHF/JPY pair, we see a bullish trend since 2001, with support for all three moving averages MA50, MA100, and MA200. These are the two currencies that are safest for investors in times of crisis. as we see, preference is given to the Swiss franc. It is expected that if the couple continues like this, it will reach a height of 120,000 and continue the bullish scenario. We first need a break below the moving averages of MA50 and MA100 (red and blue lines) for the bearish scenario.
-
Support
-
Platform
-
Spread
-
Trading Instrument

