Experienced Forex Strategies: Symmetrical Triangle Trading
Familiar with symmetrical triangle trading pattern? If yes, you must consider the difficulty it brings to traders. For instance, you can’t choose either to trade the breakout of a symmetrical triangle or wait for a pullback. You might also have a hard time thinking of where to put your stop loss, and the market won’t hunt your stops.
If you do have a hard time dealing with the symmetrical triangle pattern, this post will provide you with lessons that’ll help you analyze this pattern.
What is a Symmetrical Triangle pattern?
Symmetrical triangle trading pattern is a volatility contraction pattern appearing in a market chart. The volatility of the market shrinks – a sign that the market is soon to breakout.
Now, how can we identify a symmetrical triangle in a market chart? Let us elaborate their characteristics now.
- It is symmetrical because of the triangular sides equally slope.
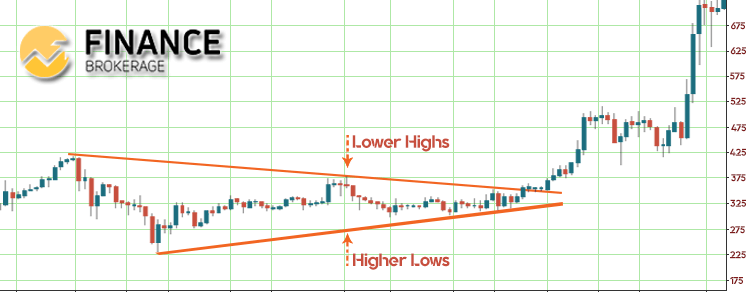
- At least two of lower highs and higher lows.
- It has a funnel look, and the prices are pressing from left going right.
Prices aren’t pressing forever, and they will soon break out. When that occurs, this will offer profitable trade opportunity. Below is a sample chart of a symmetrical triangle.
Experienced trader tip:
The symmetrical triangle appears after a few months. If it spans only a day or week, it possibly isn’t a symmetrical triangle. It could be other trend patterns.
Common mistakes:
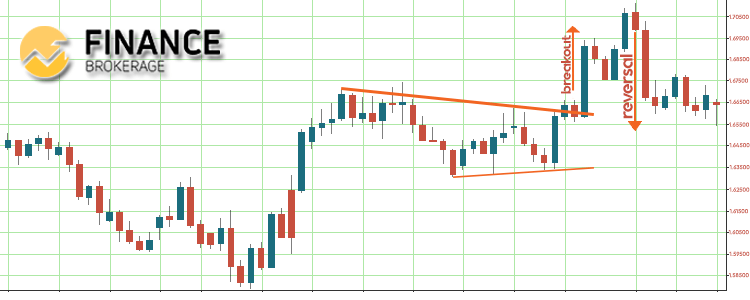
Traders usually have mistaken to chase a breakout of a symmetrical triangle. For a short-term, purchase pressure is exhausting and it’ll be sooner for you to lose energy in pushing price higher.
In these situations, smart money takes profit, and bearish traders will seem to short the markets. Slowly, the market will start to reverse sooner. Upon occurrence, traders who purchase highs will sit in the red. If they can’t take the pressure any longer, they’ll cut loses, increasing the selling pressure which will cause the market to reverse lower. Observe the sample chart below.
Trading with Symmetrical Triangle
Using various indicators such as the Moving Average (MA) will help you look for a better trading entry in a symmetrical triangle pattern. For instance, whenever the price is above the 200-period MA, you’ll have a long bias. But when the price is below 200-period MA, look at short bias. With these simple rules, you’ll be at the market’s acceptable side, improving your win rate.
Now we’ll share two techniques to help you find the right entry in a symmetrical triangle. Let us elaborate each to you.
First Pullback
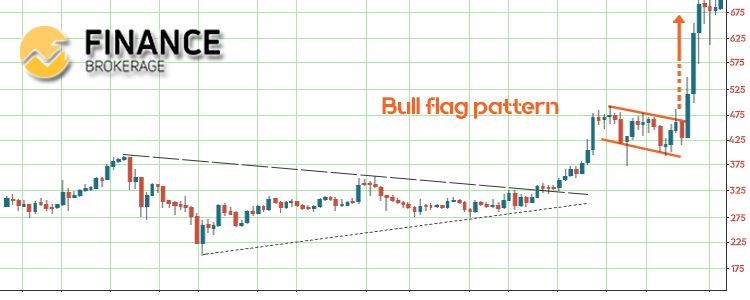
Usually, price breaks out a symmetrical triangle becoming an “overextended” breakout. Observe the sample chart below.
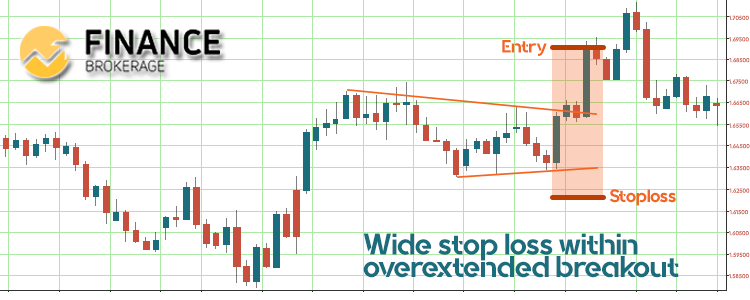
You should not enter that because overextended breakout widens your stop loss. Wait for a pullback such as a bull flag pattern to appear. Once it appeared, integrate long break of highs and get a stop loss below swing low. It’ll then offer favorable risk rewarding your trade. Observe the sample chart below.
Re-test
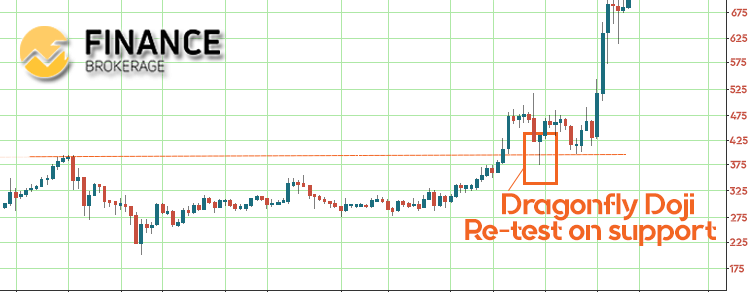
If the price breaks out of a symmetrical triangle, re-test or check the past market. After which, look for a reversal candlestick, like a hammer pattern or a Dragonfly Doji candlestick and then time your entry. Observe the sample chart below.
Maximize trade profit in a Symmetrical Triangle
There are also two techniques in maximizing trade profit with a symmetrical triangle pattern. We’ll explain it further to you now.
Trailing stop loss
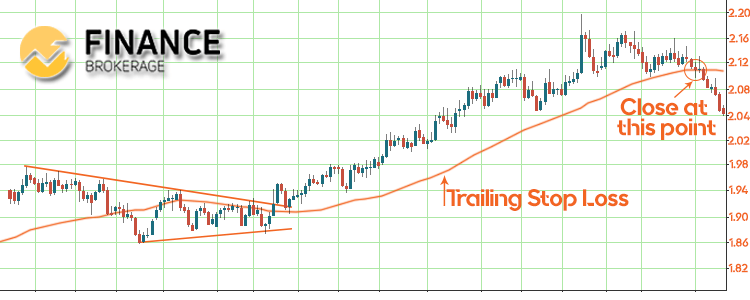
The market is dynamic. Nobody could know how high or low it could go. Using stop-loss trailing, you’ll be enabling the market to provide you positions that’ll move to your favor.
For instance, the use of a Moving Average (MA) could help you to trace your stop loss. Using 50MA to trace a stop-loss, and if the price closes below it, exit the trade. Observe the sample chart below.
Price Projection
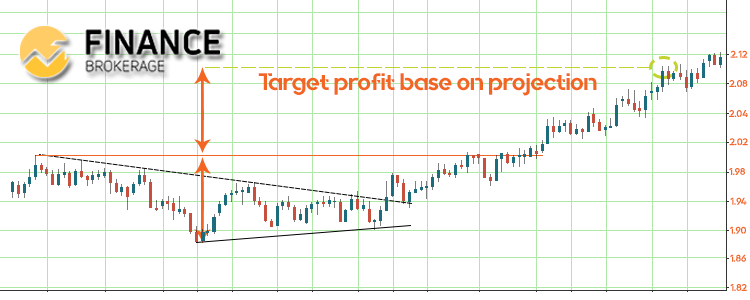
Price projection is based on classical charting systems. First, take a distance between the high and low of a symmetrical triangle – the widest point of the pattern. Second, copy and paste it as a point of breakout. Lastly, exit the trade at the projected price level. Observe the sample chart below.
Keep all these points in mind and use them in trading. Subscribe now and get updated on our latest posts.


