


EURUSD, GBPUSD, USDRUB consolidation for this Friday
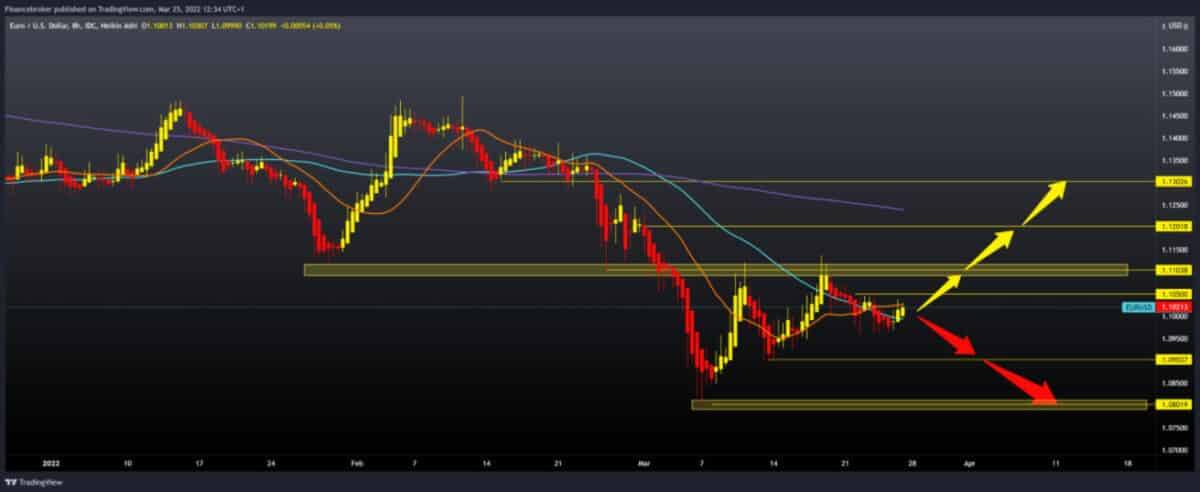
EURUSD chart analysis
During the Asian session, the euro strengthened against the dollar. The United States and the European Union decided yesterday to impose a new set of sanctions on Russia, but not energy sledges, on oil and gas imports. Earlier this week, European Central Bank President Christine Lagarde said that eurozone monetary policy would not keep pace with US Federal Reserve policy. The conflict in Ukraine and the repercussions of harsh sanctions against Russia have very different consequences for the economies of the United States and Europe. A NATO meeting is being held today, at which a new set of sanctions against Russia will be discussed, primarily in terms of the embargo on oil and gas imports. The euro is exchanged for 1.10140 dollars, representing the strengthening of the common European currency by 0.15% since the beginning of trading tonight. Pair has not formed a new lower low so far, and based on that, and we can expect a recovery of EURUSD in the following short term. It’s Friday today, and maybe that’s why it’s going slower. For the bullish option, we need the continuation of today’s consolidation and growth to the resistance zone around 1.11000. Break above that resistance, and it opens us up to 1.12000, where the additional resistance is in the MA200 moving average. For the bearish option, we need negative consolidation and withdrawal below 1.10000 levels. In the following, we are looking for the following support at 1.09000. And if it doesn’t hold up, we go down to the next lower support at 1.08000, the March low.

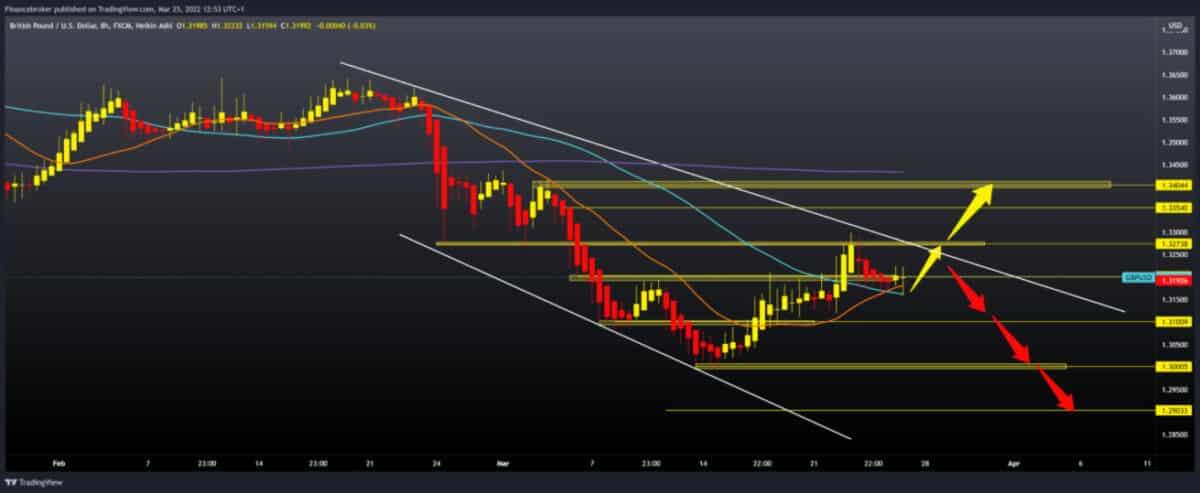
GBPUSD analysis chart
The GBPUSD pair is still in a bullish trend since March 14, when the pound fell to 1.3000. After that, the pound jumped to 1.33000 on March 22 but quickly retreated in the zone around 1.32000. Additional support at this level are our MA20 and MA50 moving averages. We need a break above 1.33000 and the upper trend line for the bullish option. Break above this level opens up space for us to the next resistance zone at the 1.34000 level. Additional resistance at that level is in the MA200 moving average. We need a negative consolidation and pullback GBPUSD below 1.31500, MA20 and MA50 moving averages for the bearish option. Our first lower support is at 1.31000, and if it doesn’t last, the next one is at 1.30000, the lower low in March.

USDRUB chart analysis
The USDRUB pair was in the range of 95,000-105.00 this week. We did not have any significant jumping below and above the support and resistance zones. If we follow the moving averages, we will notice that the pair has fallen below the MA200 moving average, which may signify increased bearish pressure. For the bearish option, we need a drop to support at 90,000. If the bearish pressure continues, our next support is at 80,000, the place where we were before the conflict in Ukraine. We need better positive consolidation and return first above the MA20 and MA50 moving averages for the bullish option. Then again, we come to the resistance at 105,000 level. A break above could take us up to 110,000 levels and an MA200 moving average. A break above would increase the bullish pressure, and our first next resistance is at 120,000 levels. If we see a jump above, then we can expect the potential formation of a new all-time high.

-
Support
-
Platform
-
Spread
-
Trading Instrument

